https://github.com/evanpatchouli/react-native-radar
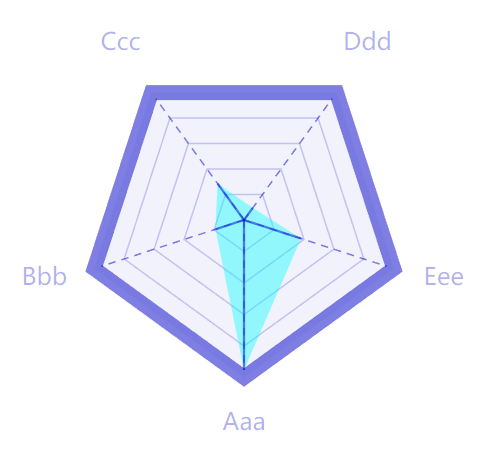
A simple radar chart for react-native.
https://github.com/evanpatchouli/react-native-radar
chart component radar react-native
Last synced: 3 months ago
JSON representation
A simple radar chart for react-native.
- Host: GitHub
- URL: https://github.com/evanpatchouli/react-native-radar
- Owner: Evanpatchouli
- License: mit
- Created: 2024-07-12T03:18:16.000Z (about 2 years ago)
- Default Branch: master
- Last Pushed: 2024-07-12T06:04:16.000Z (about 2 years ago)
- Last Synced: 2025-08-02T22:29:29.217Z (12 months ago)
- Topics: chart, component, radar, react-native
- Language: TypeScript
- Homepage:
- Size: 326 KB
- Stars: 1
- Watchers: 1
- Forks: 0
- Open Issues: 0
-
Metadata Files:
- Readme: README.md
- License: LICENSE
Awesome Lists containing this project
README
          # react-native-radar

A simple radar chart for react-native. This repo is the develop project.


## Installation

```bash

npm i @evanpatchouli/react-native-radar react-native-svg

```

## Example

```tsx

const MyRadar = (


);

```

## Props Api

You can learn from the table or the interface code at bottom.

### Table of Props:

|Prop|Description|Type|Default|

|---|---|---|---|

|data|Data to be displayed in the radar chart|number[]|[]|

|labels|Labels for each data|string[]|[]|

|radius|Radius of the radar chart|number|100|

|backgroundColor|Background color of the radar chart|string|"null"|

|strokeColor|Color of the stroke|string|"black"|

|strokeWidth|Width of the stroke|number|1|

|strokeType|Type of the stroke|"solid" \| "dashed"|"solid"|

|dashArray|Dash array of the stroke|[number, number]|[10, 5]|

|fillColor|Color of the fill area|string|"null"|

|labelProps|Props for the labels|TextProps \| ((idx: number) => TextProps)|{}|

|coefficient|Coefficient for the data|number|1|

|labelSpace|Space between the label and the radar chart|number|0|

|border|Border of the radar chart|{ type: "circle" \| "polygon" \| "none"; width?: number; color?: string; }|{ type: "none" }|

|Axis|Axis of the radar chart|{ type: "dashed" \| "solid" \| "none"; color?: string; width?: number; dashArray?: [number, number]; }|{ type: "none" }|

|ScaleLine|Scale lines of the radar chart|{ number: number; type: "dashed" \| "solid" \| "none"; color?: string; width?: number; dashArray?: [number, number]; opacity?: number; }|{ type: "none" }|

### Interface of RadarProps:

```tsx

interface RadarProps {

  data: number[];

  labels: string[];

  /** @default: 100 */

  radius?: number;

  /** @default "null" */

  backgroundColor?: string;

  strokeColor?: string;

  /** @default 1 */

  strokeWidth?: number;

  /** @default "solid" */

  strokeType?: "solid" | "dashed";

  /** @default [10,5] */

  dashArray?: [number, number];

  /** @default 1 */

  strokeOpacity?: number;

  fillColor?: string;

  labelProps?: TextProps | ((idx: number) => TextProps);

  /** @default 1 */

  coefficient?: number;

  /** @default 0 */

  labelSpace: number;

  border?: {

    type: "circle" | "polygon" | "none";

    /** @default 1 */

    width?: number;

    /** @default "black" */

    color?: string;

  };

  Axis?: {

    type: "dashed" | "solid" | "none";

    color?: string;

    width?: number;

    /** @default [10,5] */

    dashArray?: [number, number];

  };

  ScaleLine?: {

    number: number;

    type: "dashed" | "solid" | "none";

    color?: string;

    width?: number;

    /** @default [20,5] */

    dashArray?: [number, number];

    opacity?: number;

  };

}

```