https://github.com/excimetry/excimetry
Excimetry is a PHP profiling library that provides a bridge between the ext-excimer extension and various profiling tools and platforms.
https://github.com/excimetry/excimetry
excimer opentelemetry profiling pyroscope
Last synced: 12 months ago
JSON representation
Excimetry is a PHP profiling library that provides a bridge between the ext-excimer extension and various profiling tools and platforms.
- Host: GitHub
- URL: https://github.com/excimetry/excimetry
- Owner: excimetry
- License: apache-2.0
- Created: 2025-07-06T12:44:40.000Z (about 1 year ago)
- Default Branch: main
- Last Pushed: 2025-08-01T09:43:32.000Z (12 months ago)
- Last Synced: 2025-08-01T11:51:50.268Z (12 months ago)
- Topics: excimer, opentelemetry, profiling, pyroscope
- Language: PHP
- Homepage:
- Size: 1.03 MB
- Stars: 52
- Watchers: 1
- Forks: 1
- Open Issues: 3
-
Metadata Files:
- Readme: README.md
- License: LICENSE
Awesome Lists containing this project
README

# Excimetry
Excimetry is a PHP profiling library that provides a bridge between the [ext-excimer](https://www.mediawiki.org/wiki/Excimer) extension and various profiling tools and platforms. It offers a simple and flexible way to profile PHP applications and export the results to various formats and backends.



## Features
- **Simple Configuration**: Easy setup with sensible defaults
- **Flexible Profiling**: Control when and how profiling happens
- **Multiple Export Formats**:
- Collapsed format (for flamegraph tools)
- [Speedscope JSON](https://www.speedscope.app/) (for interactive flame graphs)
- OpenTelemetry OTLP (for integration with observability platforms)
- **Multiple Backends**:
- Local file storage
- HTTP/GRPC export to OpenTelemetry Collector
- Pyroscope integration
- **OpenTelemetry Integration**: Connect profiles with traces and metrics
- **Command-line Tools**: Profile PHP scripts from the command line
## Requirements
- PHP 8.2 or higher
- [ext-excimer](https://www.mediawiki.org/wiki/Excimer) extension
## Installation
### Installing the ext-excimer Extension
Before installing Excimetry, you need to install the ext-excimer extension. Here's how to do it:
#### Using PECL
```bash
pecl install excimer
```
Then add the following line to your php.ini file:
```ini
extension=excimer.so
```
#### From Source
```bash
git clone https://github.com/wikimedia/php-excimer.git
cd php-excimer
phpize
./configure
make
make install
```
Then add the following line to your php.ini file:
```ini
extension=excimer.so
```
### Installing Excimetry
Once you have the ext-excimer extension installed, you can install Excimetry using Composer:
```bash
composer require excimetry/excimetry
```
To use the command-line tool globally:
```bash
composer global require excimetry/excimetry
```
## Basic Usage
Here's a simple example of how to use Excimetry to profile a PHP application:
```php
use Excimetry\Profiler\ExcimerProfiler;
use Excimetry\Exporter\SpeedscopeExporter;
use Excimetry\Backend\FileBackend;
// Create a profiler with custom options
$profiler = new ExcimerProfiler([
'period' => 0.01, // 10ms sampling period
'mode' => 'wall', // Wall time profiling (also supports 'cpu')
]);
// Start profiling
$profiler->start();
// Your code to profile here
// ...
// Stop profiling
$profiler->stop();
// Get the profile
$log = $profiler->getLog();
// Export to speedscope format and save to a file
$exporter = new SpeedscopeExporter('My Profile');
$backend = new FileBackend($exporter, 'profiles');
$backend->send($log);
```
## Speedscope Export
[Speedscope](https://www.speedscope.app/) is an interactive flamegraph visualization tool that works in the browser. Excimetry can export profiles in the Speedscope JSON format, which can then be loaded into the Speedscope web app.
```php
use Excimetry\Profiler\ExcimerProfiler;
use Excimetry\Exporter\SpeedscopeExporter;
use Excimetry\Backend\FileBackend;
// Create a profiler
$profiler = new ExcimerProfiler();
// Start profiling
$profiler->start();
// Your code to profile here
// ...
// Stop profiling
$profiler->stop();
// Get the profile
$log = $profiler->getLog();
// Export to speedscope format with a custom profile name
$exporter = new SpeedscopeExporter('My Custom Profile');
$backend = new FileBackend($exporter, 'profiles');
// Send the profile to the backend
$backend->send($log);
// The profile will be saved to a file in the 'profiles' directory
// You can then load this file into https://www.speedscope.app/
```
## Command-line Profiling
Excimetry includes a command-line tool for profiling PHP scripts. This is useful for profiling scripts that run from the command line, such as cron jobs or CLI applications.
```bash
# Basic usage
excimetry-profile path/to/script.php
# With custom options
excimetry-profile --period=0.01 --mode=wall --format=speedscope --output=profiles path/to/script.php
# Pass arguments to the script
excimetry-profile path/to/script.php arg1 arg2 arg3
```
Options:
- `--period=`: Sampling period in seconds (default: 0.01)
- `--mode=`: Profiling mode: wall or cpu (default: wall)
- `--format=`: Output format: speedscope or collapsed (default: speedscope)
- `--output=`: Output directory (default: profiles)
- `--help`: Display help message
## OpenTelemetry Integration
[OpenTelemetry](https://opentelemetry.io/) is an observability framework for cloud-native software. Excimetry can send profiles to an OpenTelemetry Collector, which can then forward them to various backends.
```php
use Excimetry\OpenTelemetry\OpenTelemetryIntegration;
// Create an integration with the OpenTelemetry Collector
$integration = OpenTelemetryIntegration::create(
'http://localhost:4318', // OpenTelemetry Collector URL
'my-service' // Service name
);
// Start profiling
$integration->start();
// Your code to profile here
// ...
// Stop profiling and send to OpenTelemetry
$integration->stop();
// You can also add trace and span IDs to connect profiles with traces
$integration->addTraceId('trace-id');
$integration->addSpanId('span-id');
// Add custom metadata
$integration->addMetadata('version', '1.0.0');
$integration->addMetadata('environment', 'production');
// Access the underlying profiler and backend
$profiler = $integration->getProfiler();
$backend = $integration->getBackend();
```
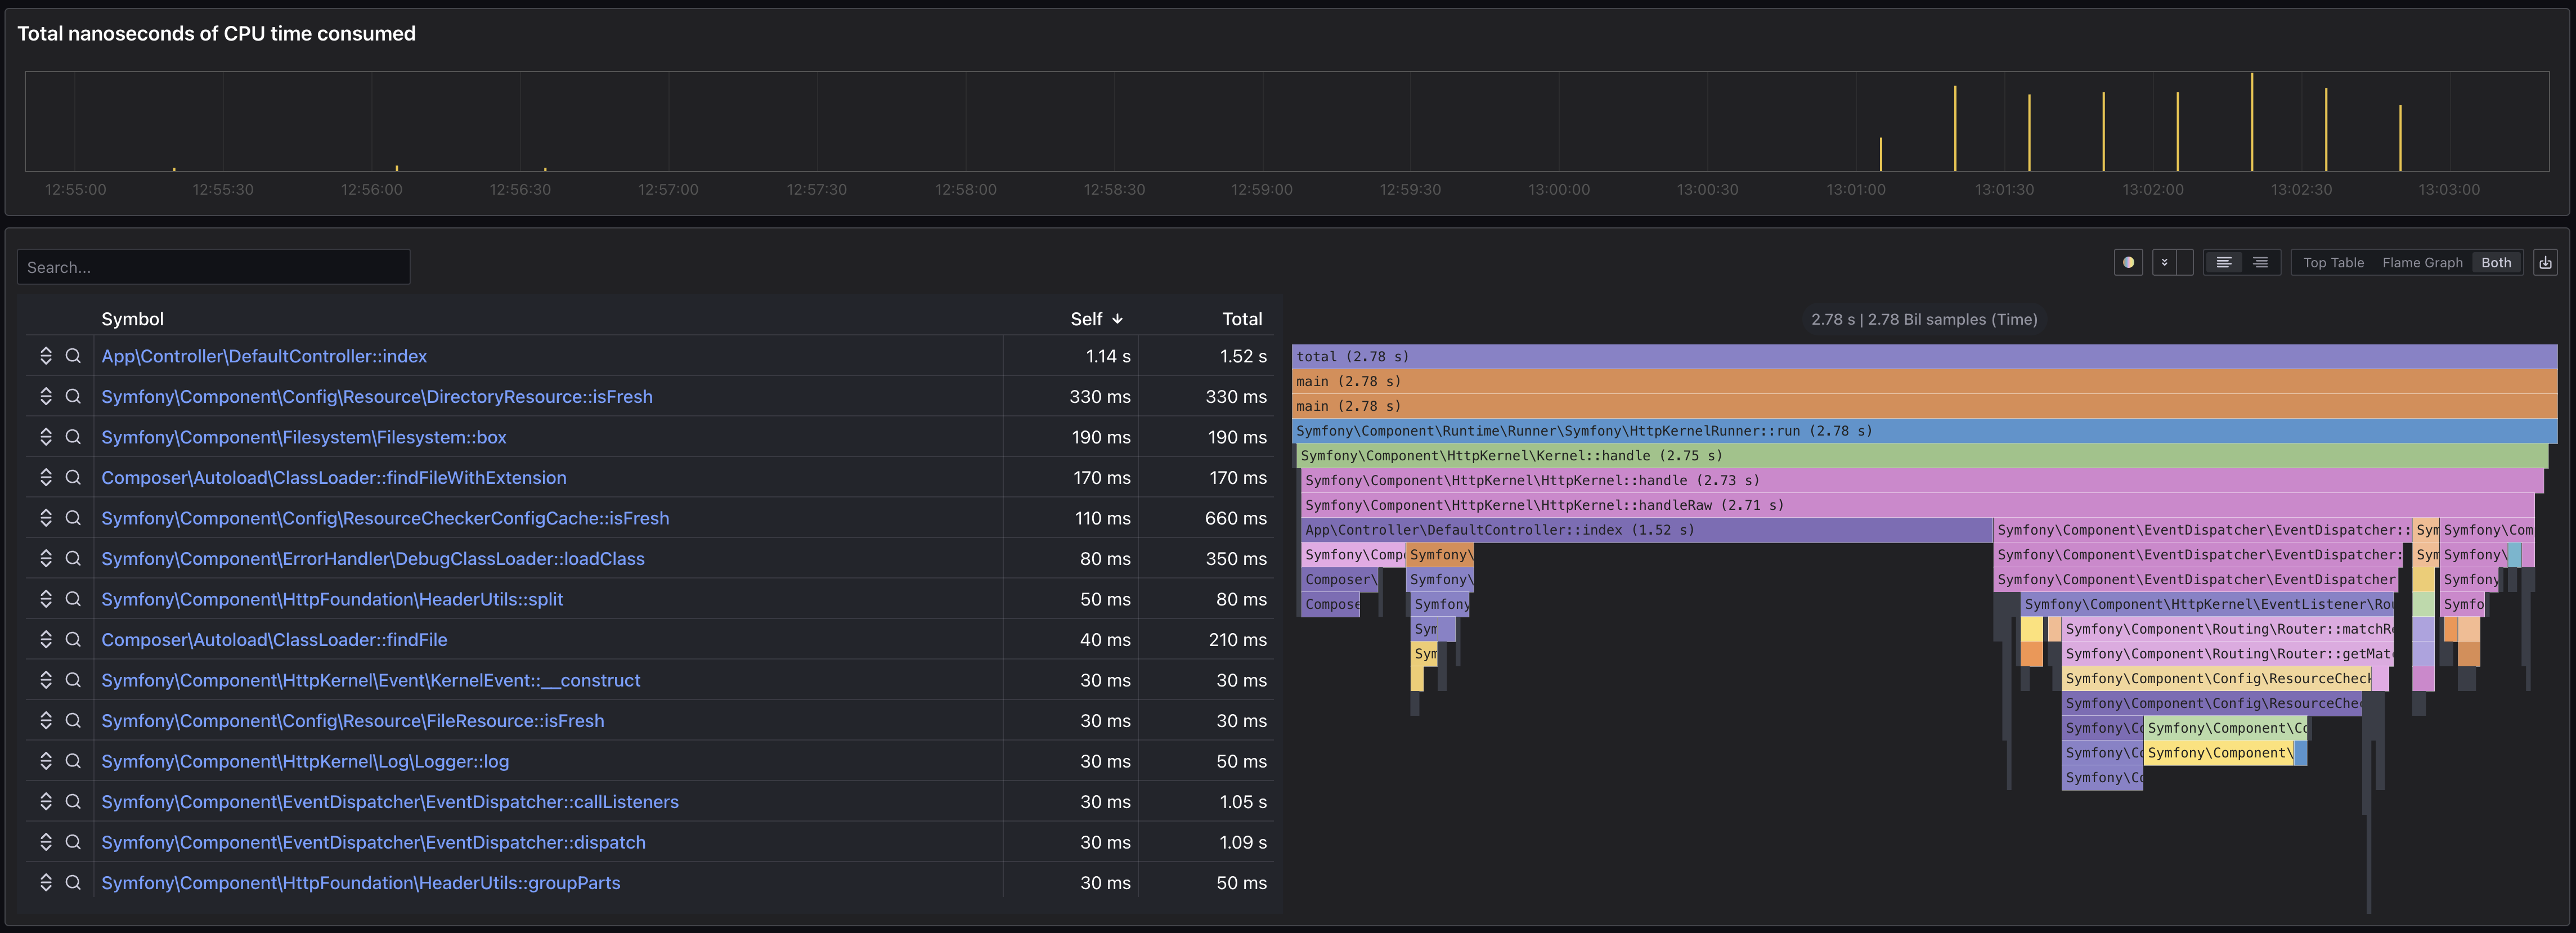
## Pyroscope Integration
[Pyroscope](https://pyroscope.io/) is a continuous profiling platform that helps you find performance issues in your code. Excimetry can send profiles directly to a Pyroscope server.
```php
use Excimetry\Profiler\ExcimerProfiler;
use Excimetry\Exporter\CollapsedExporter;
use Excimetry\Backend\PyroscopeBackend;
// Create a profiler
$profiler = new ExcimerProfiler();
// Start profiling
$profiler->start();
// Your code to profile here
// ...
// Stop profiling
$profiler->stop();
// Get the profile
$log = $profiler->getLog();
// Send to Pyroscope
$exporter = new CollapsedExporter();
$backend = new PyroscopeBackend(
serverUrl: 'http://localhost:4040',
appName: 'my-application',
labels: ['env' => 'production'],
exporter: $exporter,
);
// Send the profile to Pyroscope
$backend->send($log);
// You can also set the backend to send asynchronously
$backend->setAsync(true);
$backend->send($log); // Returns immediately, sends in background
// Add custom labels
$backend->addLabel('version', '1.0.0');
$backend->addLabel('region', 'us-west');
```
## Advanced Usage
### Custom Metadata
```php
$profiler = new ExcimerProfiler();
$profiler->addMetadata('version', '1.0.0');
$profiler->addMetadata('environment', 'production');
```
### Async Export
```php
$backend = new HttpBackend($exporter, 'http://example.com/profiles');
$backend->setAsync(true);
$backend->send($log); // Returns immediately, sends in background
```
### Retry Configuration
```php
$backend = new HttpBackend($exporter, 'http://example.com/profiles');
$backend->setRetryConfig(5, 1000); // 5 retries, 1 second delay
$backend->send($log);
```
## Troubleshooting
### Common Issues
#### ext-excimer Not Found
If you get an error like "Class 'Excimer' not found", it means the ext-excimer extension is not installed or not enabled. Make sure you have installed the extension and added it to your php.ini file.
#### Permission Issues
If you're having trouble saving profiles to a directory, make sure the directory exists and is writable by the PHP process.
#### Memory Issues
Profiling can use a significant amount of memory, especially for long-running processes. If you're experiencing memory issues, try increasing the memory limit in your php.ini file or reducing the sampling frequency.
## Contributing
Contributions are welcome! Please feel free to submit a Pull Request.
## License
This project is licensed under the Apache License 2.0 - see the LICENSE file for details.