https://github.com/eyeseast/datasette-geojson-map
Render a map for any query with a geometry column
https://github.com/eyeseast/datasette-geojson-map
datasette-io datasette-plugin geojson gis leafletjs mapping
Last synced: 11 months ago
JSON representation
Render a map for any query with a geometry column
- Host: GitHub
- URL: https://github.com/eyeseast/datasette-geojson-map
- Owner: eyeseast
- Created: 2021-07-05T01:54:13.000Z (almost 5 years ago)
- Default Branch: main
- Last Pushed: 2024-08-10T21:47:47.000Z (almost 2 years ago)
- Last Synced: 2025-07-18T12:40:51.783Z (11 months ago)
- Topics: datasette-io, datasette-plugin, geojson, gis, leafletjs, mapping
- Language: Python
- Homepage:
- Size: 5.33 MB
- Stars: 27
- Watchers: 2
- Forks: 1
- Open Issues: 17
-
Metadata Files:
- Readme: README.md
Awesome Lists containing this project
README
# datasette-geojson-map
[](https://pypi.org/project/datasette-geojson-map/)
[](https://github.com/eyeseast/datasette-geojson-map/releases)
[](https://github.com/eyeseast/datasette-geojson-map/actions?query=workflow%3ATest)
[](https://github.com/eyeseast/datasette-geojson-map/blob/main/LICENSE)
Render a map for any query with a geometry column
## Installation
Install this plugin in the same environment as Datasette.
$ datasette install datasette-geojson-map
## Usage
Start by loading a GIS file.
For example, you might use [geojson-to-sqlite](https://pypi.org/project/geojson-to-sqlite/) or [shapefile-to-sqlite](https://pypi.org/project/shapefile-to-sqlite/) to load [neighborhood boundaries](https://bostonopendata-boston.opendata.arcgis.com/datasets/3525b0ee6e6b427f9aab5d0a1d0a1a28_0/explore) into a SQLite database.
```sh
wget -O neighborhoods.geojson https://opendata.arcgis.com/datasets/3525b0ee6e6b427f9aab5d0a1d0a1a28_0.geojson
geojson-to-sqlite boston.db neighborhoods neighborhoods.geojson
```
(The command above uses Spatialite, but that's not required.)
Start up `datasette` and navigate to the `neighborhoods` table.
```sh
datasette serve boston.db
# in another terminal tab
open http://localhost:8001/boston/neighborhoods
```
You should see a map centered on Boston with each neighborhood outlined. Clicking a boundary will bring up a popup with details on that feature.
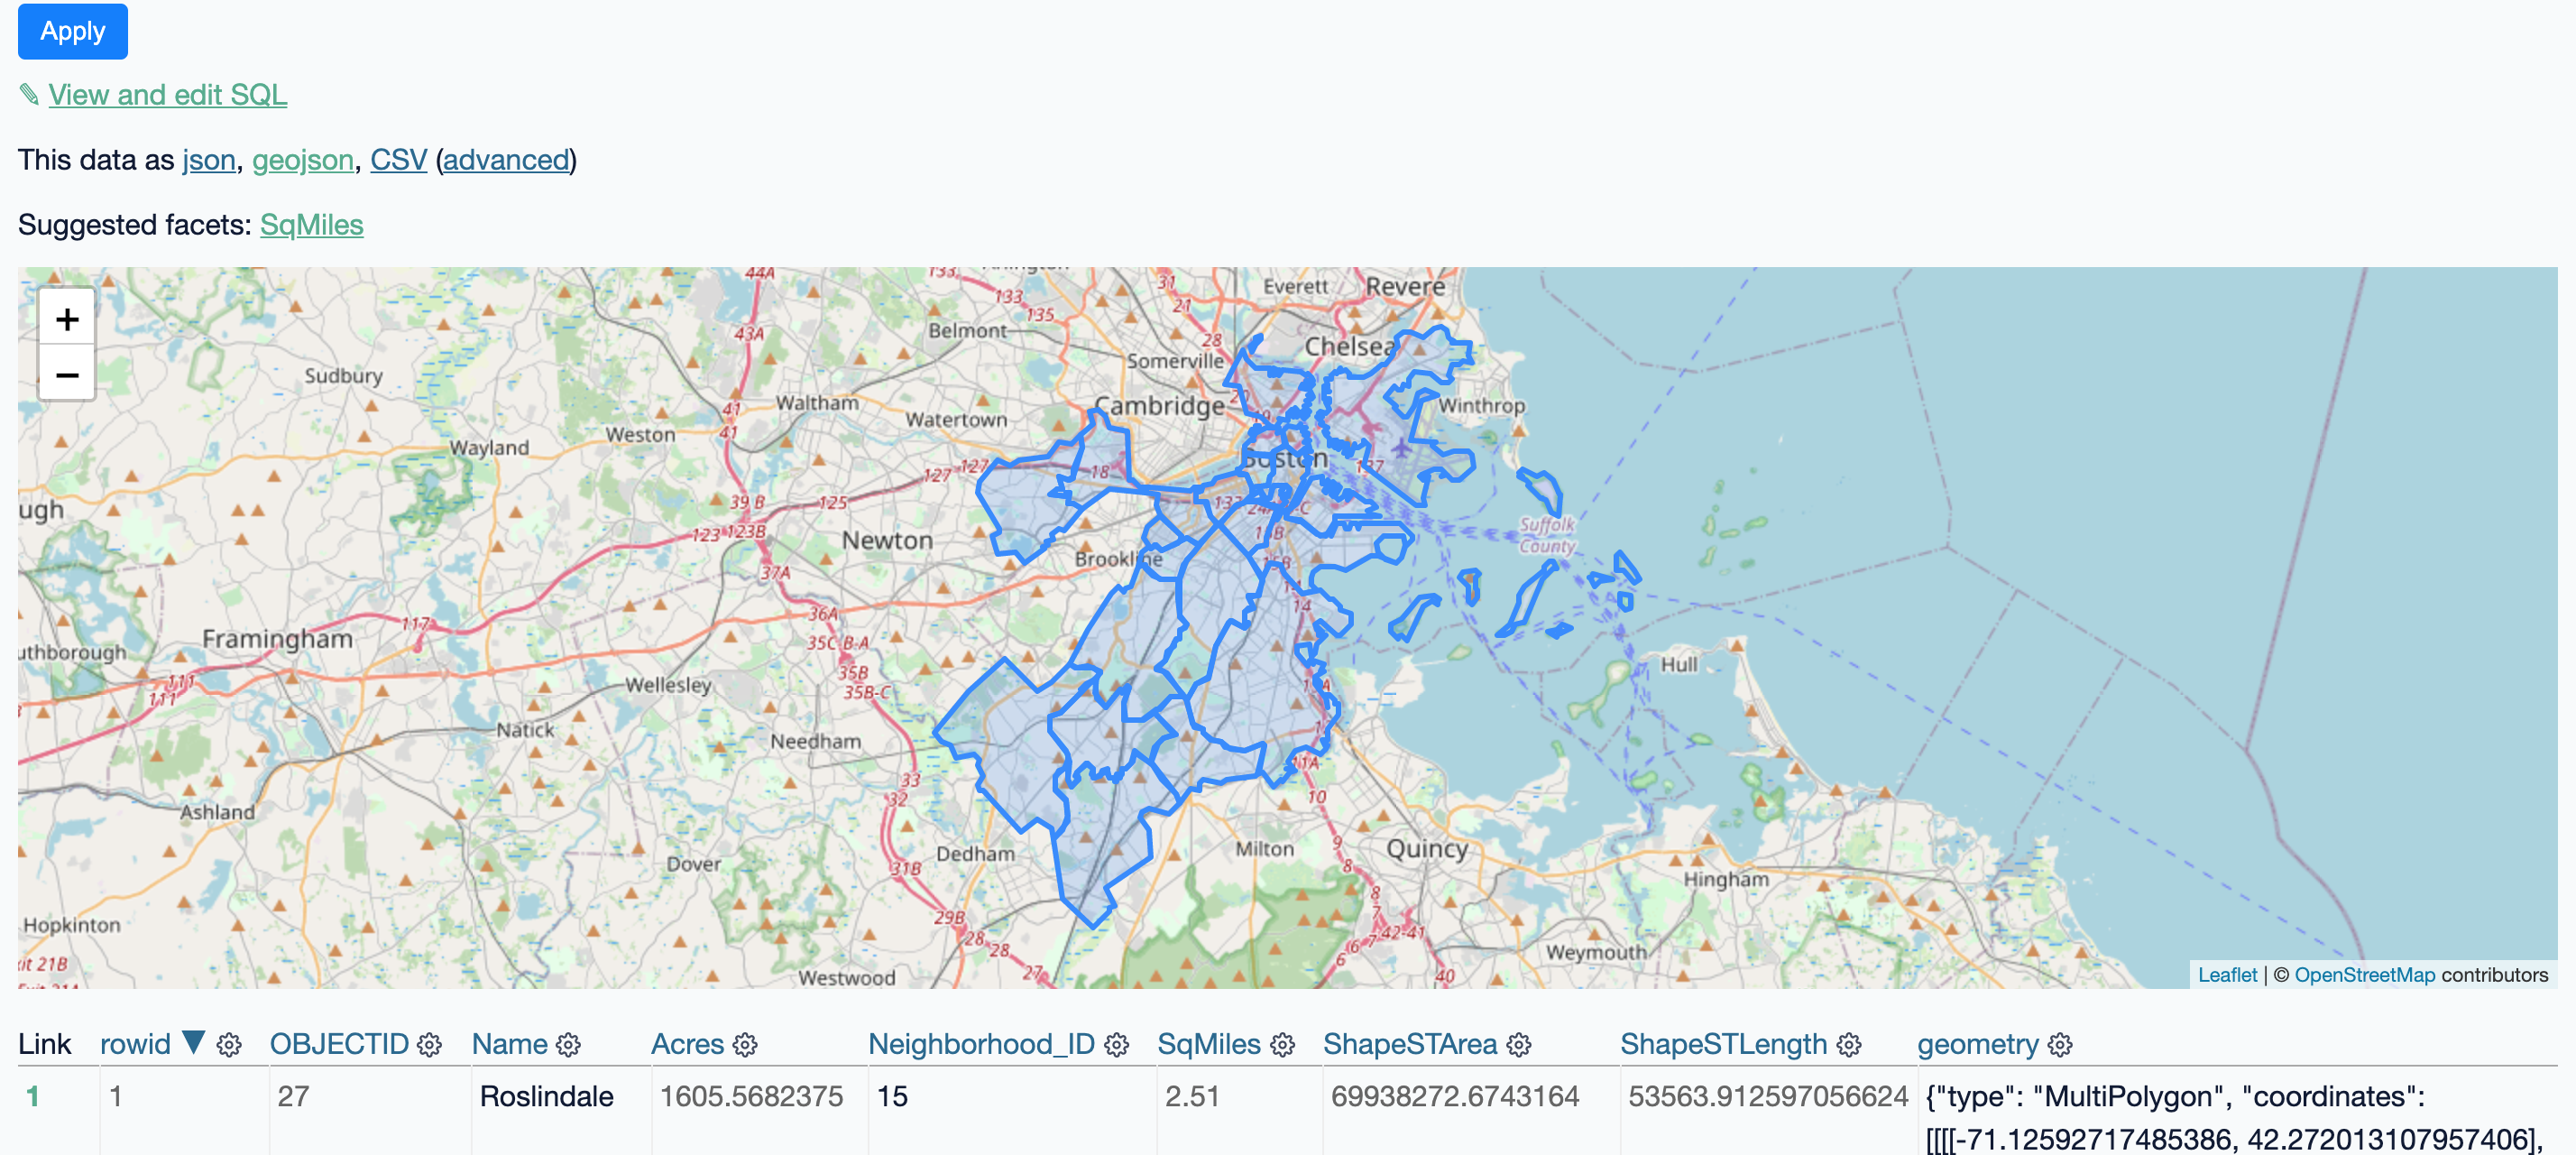
This plugin relies on (and will install) [datasette-geojson](https://github.com/eyeseast/datasette-geojson). Any query that includes a `geometry` column will produce a map of the results. This also includes single row views.
Run the included `demo` project to see it live.
## Configuration
This project uses the same map configuration as [datasette-cluster-map](https://github.com/simonw/datasette-cluster-map). Here's how you would use [Stamen's terrain tiles](http://maps.stamen.com/terrain/#12/37.7706/-122.3782):
```yaml
plugins:
datasette-geojson-map:
tile_layer: https://stamen-tiles-{s}.a.ssl.fastly.net/terrain/{z}/{x}/{y}.{ext}
tile_layer_options:
attribution: >-
Map tiles by Stamen Design,
under CC BY 3.0.
Data by OpenStreetMap,
under ODbL.
subdomains: abcd
minZoom: 1
maxZoom: 16
ext: jpg
```
Options:
- `tile_layer`: Use a URL template that can be passed to a [Leaflet Tilelayer](https://leafletjs.com/reference-1.7.1.html#tilelayer)
- `tile_layer_options`: All options will be passed to the tile layer. See [Leaflet documentation](https://leafletjs.com/reference-1.7.1.html#tilelayer) for more on possible values here.
## Styling map features
Map features can be styled using the [simplestyle-spec](https://github.com/mapbox/simplestyle-spec). This requires setting specific fields on returned rows. Here's an example:
```sql
SELECT Name, geometry, "#ff0000" as fill, "#0000ff" as stroke, 0.2 as stroke-width, from neighborhoods
```
That will render a neighborhood map where each polygon is filled in red, outlined in blue and lines are 0.2 pixels wide.
A more useful approach would use the `CASE` statement to color features based on data:
```sql
SELECT
Name,
geometry,
CASE
Name
WHEN "Roslindale" THEN "#ff0000"
WHEN "Dorchester" THEN "#0000ff"
ELSE "#dddddd"
END fill
FROM
neighborhoods
```
This will fill Roslindale in red, Dorchester in blue and all other neighborhoods in gray.
## Development
To set up this plugin locally, first checkout the code. Then create a new virtual environment:
cd datasette-geojson-map
python3 -mvenv venv
source venv/bin/activate
Or if you are using `pipenv`:
pipenv shell
Now install the dependencies and test dependencies:
pip install -e '.[test]'
To run the tests:
pytest