https://github.com/facebookresearch/hiplot
HiPlot makes understanding high dimensional data easy
https://github.com/facebookresearch/hiplot
Last synced: 9 months ago
JSON representation
HiPlot makes understanding high dimensional data easy
- Host: GitHub
- URL: https://github.com/facebookresearch/hiplot
- Owner: facebookresearch
- License: mit
- Archived: true
- Created: 2019-11-08T13:06:41.000Z (over 6 years ago)
- Default Branch: main
- Last Pushed: 2024-01-10T07:43:27.000Z (over 2 years ago)
- Last Synced: 2025-09-18T17:39:37.459Z (9 months ago)
- Language: TypeScript
- Homepage: https://facebookresearch.github.io/hiplot/
- Size: 516 MB
- Stars: 2,801
- Watchers: 27
- Forks: 147
- Open Issues: 20
-
Metadata Files:
- Readme: README.md
- Contributing: CONTRIBUTING.md
- License: LICENSE
- Code of conduct: CODE_OF_CONDUCT.md
Awesome Lists containing this project
- awesome-list - HiPlot - A lightweight interactive visualization tool to help AI researchers discover correlations and patterns in high-dimensional data. (Data Visualization / Data Management)
- awesome-starred - facebookresearch/hiplot - HiPlot makes understanding high dimensional data easy (others)
- awesome-python-machine-learning-resources - GitHub - 15% open · ⏱️ 05.07.2022): (数据可视化)
README
# HiPlot - High dimensional Interactive Plotting [](https://circleci.com/gh/facebookresearch/hiplot/tree/main)

[](https://opensource.fb.com/support-ukraine)
[](https://opensource.org/licenses/MIT)
[](https://pypi.python.org/pypi/hiplot/) [](https://pypi.python.org/pypi/hiplot/) [](https://facebookresearch.github.io/hiplot/index.html) [](https://colab.research.google.com/github/facebookresearch/hiplot/blob/main/examples/HiPlotColabExample.ipynb)
HiPlot is a lightweight interactive visualization tool to help AI researchers discover correlations and patterns in high-dimensional data using parallel plots and other graphical ways to represent information.
### [Try a demo now with sweep data](https://facebookresearch.github.io/hiplot/_static/demo/ml1.csv.html) or [upload your CSV](https://facebookresearch.github.io/hiplot/_static/hiplot_upload.html) or [](https://colab.research.google.com/github/facebookresearch/hiplot/blob/main/examples/HiPlotColabExample.ipynb)
There are several modes to HiPlot:
- As a web-server (if your data is a CSV for instance)
- In a jupyter notebook (to visualize python data), or in [Streamlit apps](https://facebookresearch.github.io/hiplot/tuto_streamlit.html)
- In CLI to render standalone HTML
```bash
pip install -U hiplot # Or for conda users: conda install -c conda-forge hiplot
```
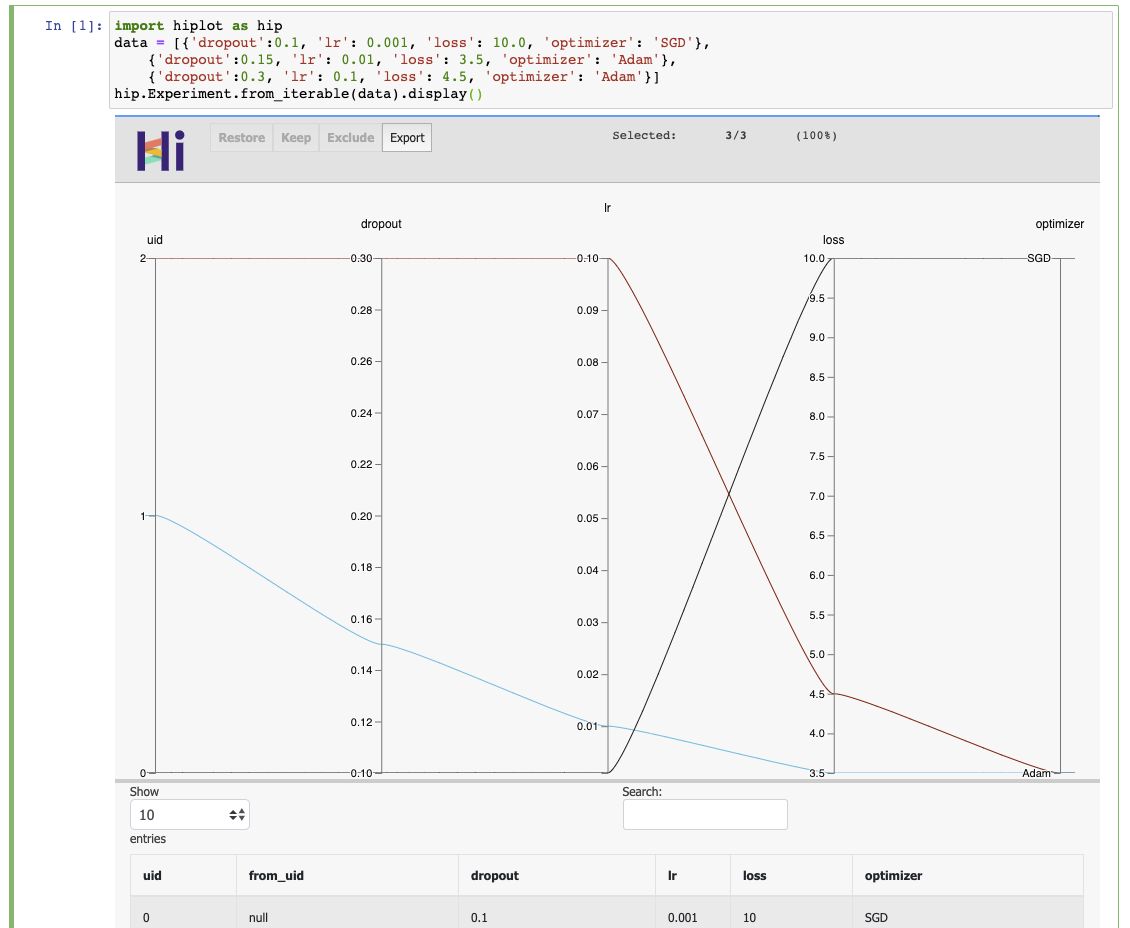
If you have a jupyter notebook, you can get started with something as simple as:
```python
import hiplot as hip
data = [{'dropout':0.1, 'lr': 0.001, 'loss': 10.0, 'optimizer': 'SGD'},
{'dropout':0.15, 'lr': 0.01, 'loss': 3.5, 'optimizer': 'Adam'},
{'dropout':0.3, 'lr': 0.1, 'loss': 4.5, 'optimizer': 'Adam'}]
hip.Experiment.from_iterable(data).display()
```
### [See the live result](https://facebookresearch.github.io/hiplot/_static/demo/demo_basic_usage.html)
## Links
* Blog post: https://ai.facebook.com/blog/hiplot-high-dimensional-interactive-plots-made-easy/
* Documentation: https://facebookresearch.github.io/hiplot/index.html
* Pypi package: https://pypi.org/project/hiplot/
* Conda package: https://anaconda.org/conda-forge/hiplot
* NPM package: https://www.npmjs.com/package/hiplot
* Examples: https://github.com/facebookresearch/hiplot/tree/main/examples
## Citing
```bibtex
@misc{hiplot,
author = {Haziza, D. and Rapin, J. and Synnaeve, G.},
title = {{Hiplot, interactive high-dimensionality plots}},
year = {2020},
publisher = {GitHub},
journal = {GitHub repository},
howpublished = {\url{https://github.com/facebookresearch/hiplot}},
}
```
## Credits
Inspired by and based on code from [Kai Chang](http://bl.ocks.org/syntagmatic/3150059), [Mike Bostock](http://bl.ocks.org/1341021) and [Jason Davies](http://bl.ocks.org/1341281).
External contributors (*please add your name when you submit your first pull request*):
- [louismartin](https://github.com/louismartin)
- [GoldenCorgi](https://github.com/GoldenCorgi)
- [callistachang](https://github.com/callistachang)
## License
HiPlot is [MIT](LICENSE) licensed, as found in the [LICENSE](LICENSE) file.