https://github.com/faridrashidi/cnsplots
🎨 Toolkit for generating publication-quality plots for Cell, Nature and Science journals
https://github.com/faridrashidi/cnsplots
data-science data-visualization plotting publication-quality python scientific-publications
Last synced: 3 months ago
JSON representation
🎨 Toolkit for generating publication-quality plots for Cell, Nature and Science journals
- Host: GitHub
- URL: https://github.com/faridrashidi/cnsplots
- Owner: faridrashidi
- License: bsd-3-clause
- Created: 2023-01-22T19:28:36.000Z (over 3 years ago)
- Default Branch: main
- Last Pushed: 2026-04-01T18:28:19.000Z (3 months ago)
- Last Synced: 2026-04-02T05:31:13.645Z (3 months ago)
- Topics: data-science, data-visualization, plotting, publication-quality, python, scientific-publications
- Language: Python
- Homepage: https://cnsplots.farid.one
- Size: 147 MB
- Stars: 13
- Watchers: 1
- Forks: 0
- Open Issues: 0
-
Metadata Files:
- Readme: README.md
- Contributing: .github/CONTRIBUTING.md
- License: LICENSE.md
- Code of conduct: .github/CODE_OF_CONDUCT.md
- Agents: AGENTS.md
Awesome Lists containing this project
README
# cnsplots

[](https://github.com/faridrashidi/cnsplots/actions/workflows/ci-tests.yml)
[](https://cnsplots.farid.one/)
[](https://pypi.org/project/cnsplots/)
[](https://pypi.org/project/cnsplots/)
[](https://github.com/faridrashidi/cnsplots/blob/main/LICENSE.md)
**Publication-Ready Scientific Plots for Cell, Nature, and Science Journals**
Create visually stunning, journal-quality figures with minimal code. Built on matplotlib, fully compatible with seaborn, and optimized for Adobe Illustrator.
[Documentation](https://cnsplots.farid.one/) · [Examples Gallery](https://cnsplots.farid.one/latest/examples/index.html) · [Report Bug](https://github.com/faridrashidi/cnsplots/issues) · [Request Feature](https://github.com/faridrashidi/cnsplots/issues)
---
## Overview
[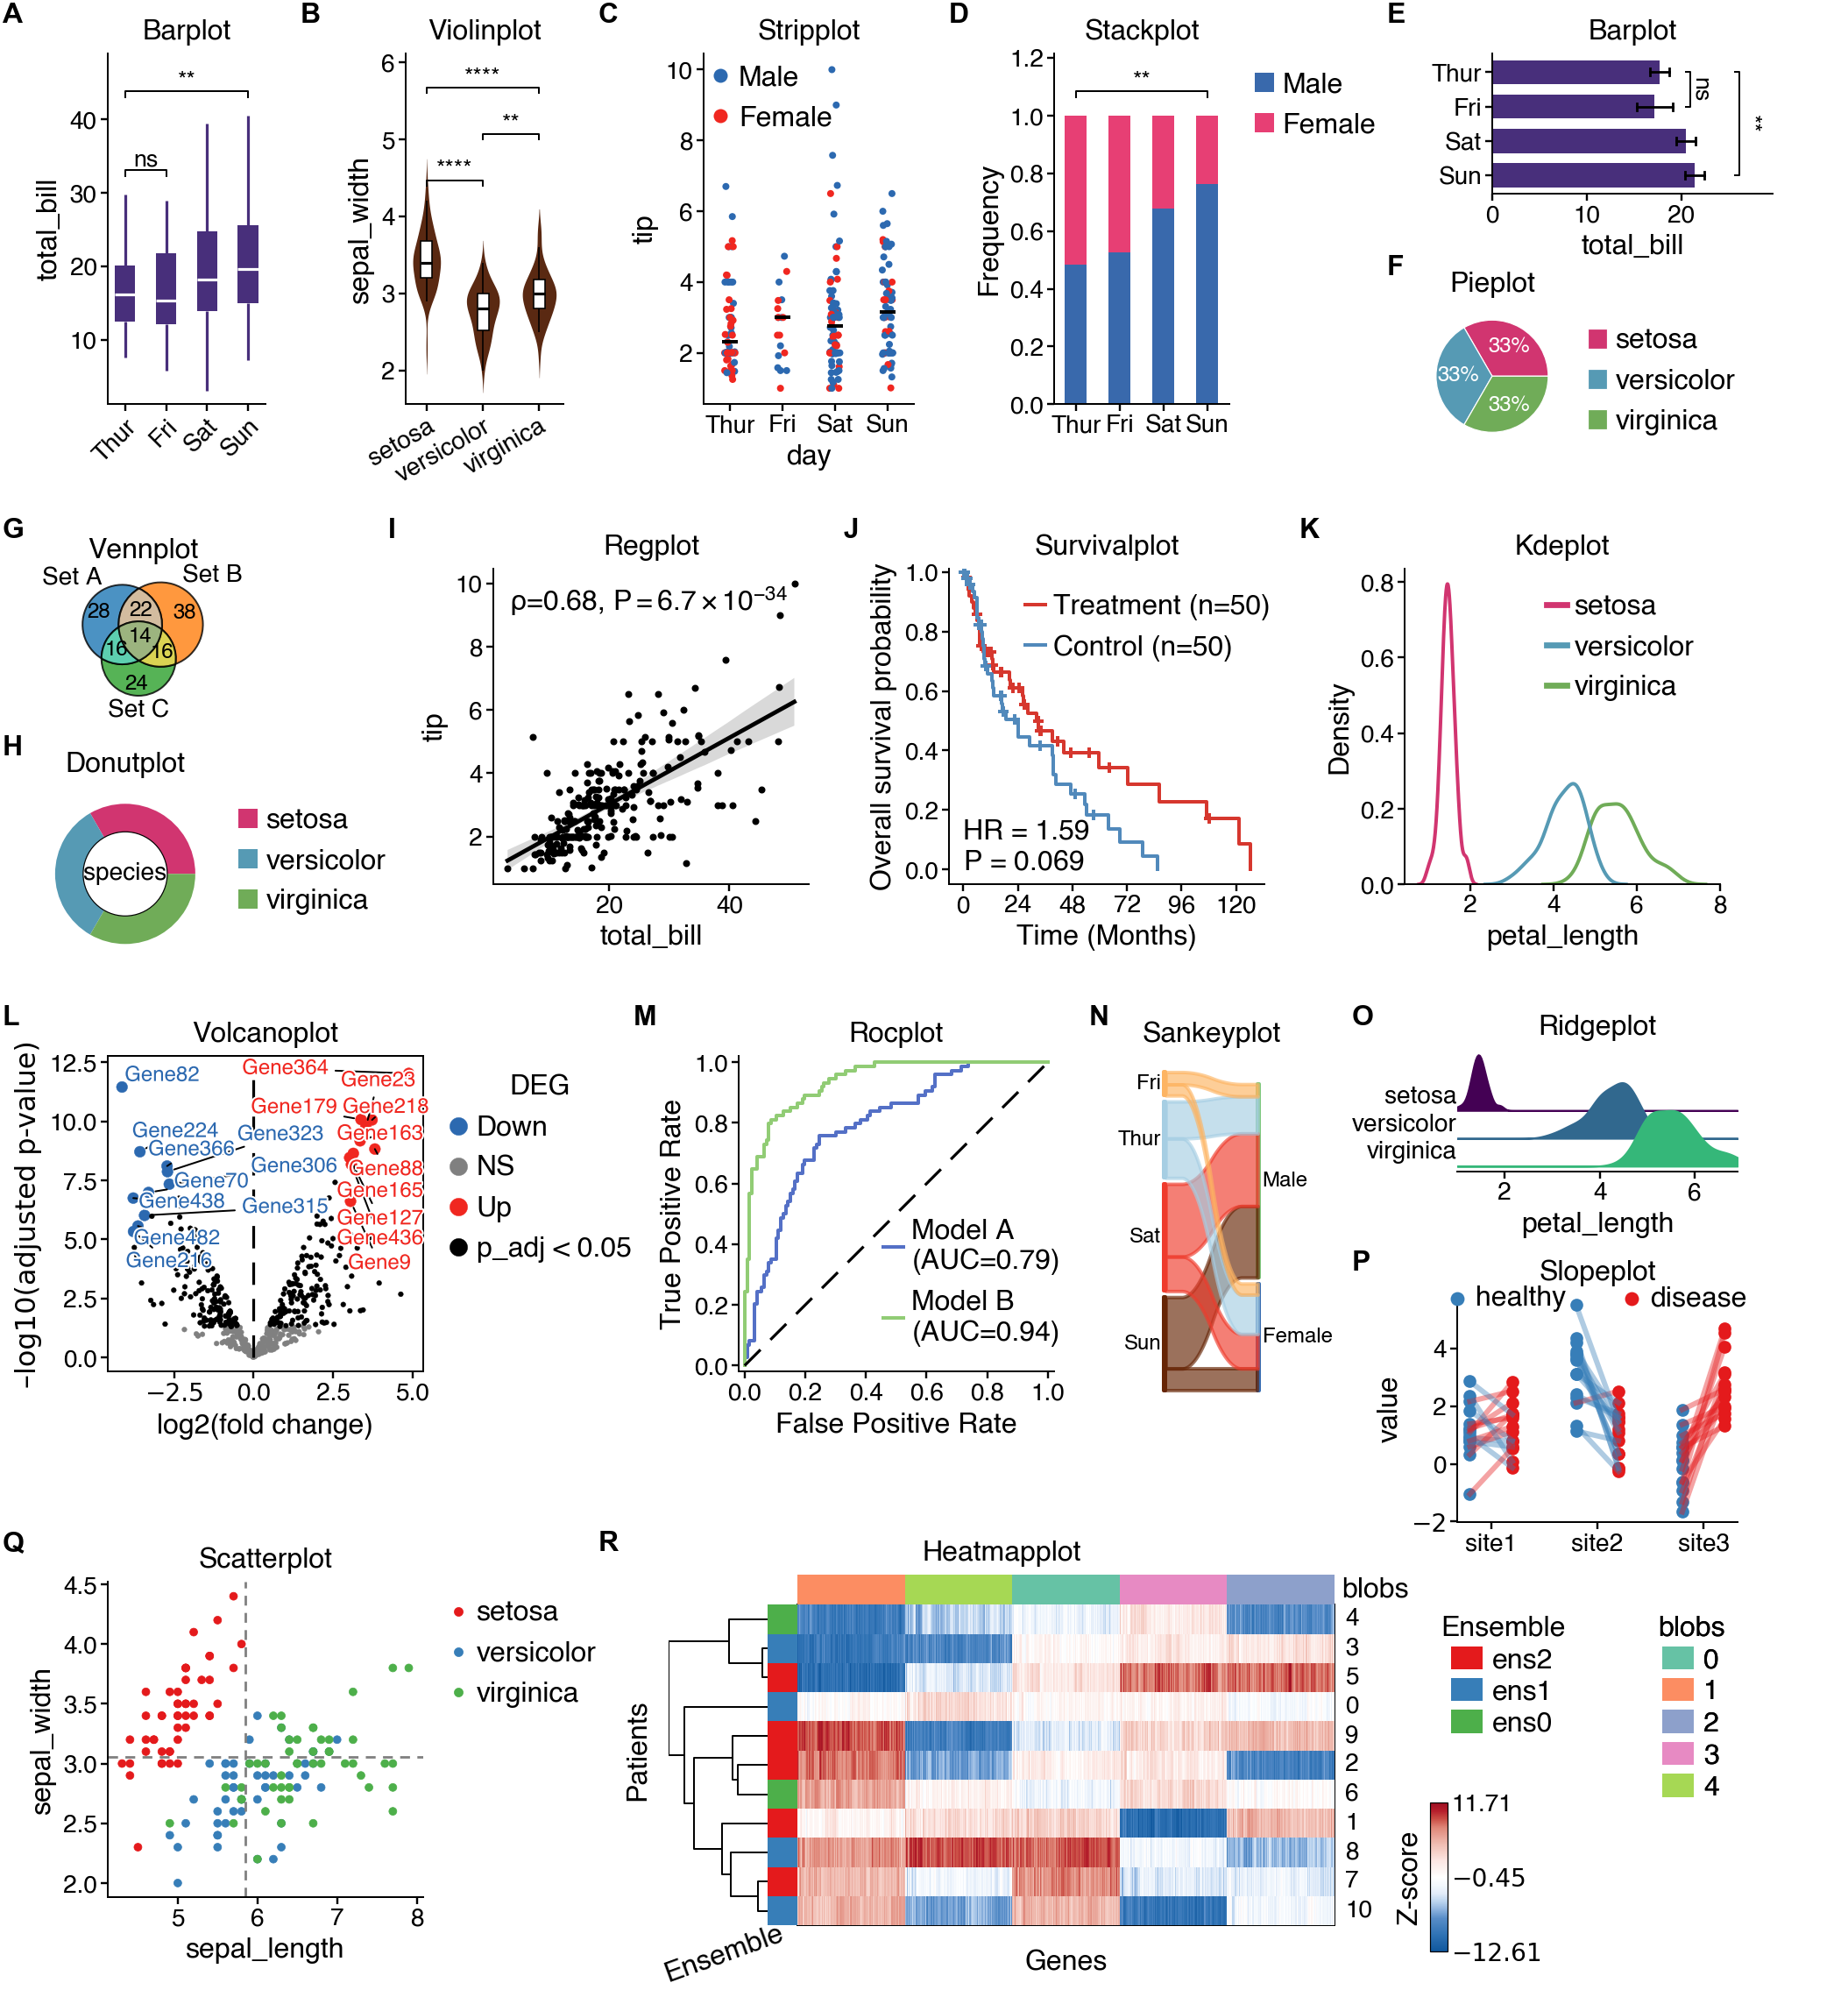](https://cnsplots.farid.one/latest/examples/showcase.html#figure-1)
**cnsplots** is a Python visualization library designed specifically for creating publication-ready scientific figures. It takes care of the tedious styling details so you can focus on your science.
### Why cnsplots?
- 🎨 **Publication-Ready**: Pre-configured styles matching Cell, Nature, and Science journal requirements
- 🎯 **Simple API**: Create complex multi-panel figures with just a few lines of code
- 📐 **Precise Control**: Specify dimensions in pixels, perfect for journal submission guidelines
- 🖋️ **Adobe Illustrator Compatible**: SVG exports with editable fonts (no text-to-path conversion)
- 📊 **Statistical Integration**: Built-in statistical tests and annotations
- 🔧 **Highly Customizable**: Full control over colors, fonts, and styling
- 🌈 **Rich Color Palettes**: Curated color schemes optimized for scientific visualization
- 🧩 **Multi-Panel Support**: Easy creation of complex figure layouts
## Features
### 📊 25+ Plot Types
**Basic Plots**
- Box plots, violin plots, bar plots, strip plots
- Scatter plots, line plots, regression plots
- Histograms, KDE plots, ridge plots
**Scientific Plots**
- Survival plots (Kaplan-Meier)
- Cumulative incidence plots
- ROC curves and forest plots
- Volcano plots and GSEA plots
- Confusion matrices
**Specialized Plots**
- Heatmaps with hierarchical clustering
- Dot plots for enrichment
- Venn diagrams and UpSet plots
- Sankey diagrams
- Pie and donut charts
- QQ plots and slope plots
### 🎨 Beautiful Color Palettes
Multiple curated palettes including:
- **Qualitative**: Cell, Nature, Science, Ecotyper1-6, Set1-3, Tableau, Bold
- **Sequential**: Parula, gnuplot, custom gradients
- **Diverging**: BlueRed, BuRd_custom, OrBu_custom
### 📐 Multi-Panel Figures
Create complex layouts with automatic panel labeling (A, B, C...):
```python
import cnsplots as cns
mp = cns.multipanel(max_width=540)
# Panel A
mp.panel("A", height=150, width=150)
cns.boxplot(data=df1, x="group", y="value")
# Panel B
mp.panel("B", height=150, width=150)
cns.scatterplot(data=df2, x="x", y="y")
# Continues...
```
## Installation
### From PyPI
```bash
pip install cnsplots
```
### For Development
First install [uv](https://docs.astral.sh/uv/), then:
```bash
git clone https://github.com/faridrashidi/cnsplots
cd cnsplots
make install
```
This installs the package with its development and documentation extras. Core
scientific integrations such as `scanpy`, `lifelines`, and `gseapy` remain
runtime dependencies of `cnsplots` itself.
## Quick Start
### Basic Usage
```python
import cnsplots as cns
import seaborn as sns
# Load example data
df = sns.load_dataset("tips")
# Create a figure (height, width in pixels)
cns.figure(height=150, width=100)
# Create a publication-ready boxplot
cns.boxplot(data=df, x="day", y="total_bill")
# Save as vector graphic
cns.savefig("figure.svg")
```
### Statistical Comparisons
```python
# Add statistical significance annotations
cns.figure(150, 150)
cns.boxplot(
data=df,
x="day",
y="total_bill",
pairs=[("Thur", "Fri"), ("Sat", "Sun")], # Compare these pairs
)
# Prints: P-values were determined by two-sided Mann-Whitney U test.
```
### Custom Colors
```python
# Use custom color palette
cns.figure(150, 200, color_cycle="Ecotyper1")
cns.violinplot(data=df, x="day", y="total_bill", hue="sex")
```
## Examples Gallery
Explore our comprehensive [examples gallery](https://cnsplots.farid.one/latest/examples/index.html) featuring:
- 📦 Basic statistical plots
- 🧬 Genomics and bioinformatics visualizations
- 📈 Time-series and survival analysis
- 🎯 Machine learning results (ROC, confusion matrices)
- 🔬 Multi-omics data visualization
- 🎨 Custom color schemes and styling
## Documentation
Full documentation is available at [cnsplots.farid.one](https://cnsplots.farid.one/)
- [Installation Guide](https://cnsplots.farid.one/latest/installation.html)
- [API Reference](https://cnsplots.farid.one/latest/api.html)
- [Examples Gallery](https://cnsplots.farid.one/latest/examples/index.html)
## Key Concepts
### Figure Dimensions
Specify sizes in **pixels** for precise control:
```python
cns.figure(height=150, width=100) # Final canvas size is 150px × 100px
```
### Color Palettes
Access curated color palettes:
```python
# Qualitative palettes (for categorical data)
cns.figure(color_cycle="Ecotyper1") # Default, optimized for journals
cns.figure(color_cycle="Cell") # Custom Cell-inspired journal palette
cns.figure(color_cycle="Nature") # Nature-inspired journal palette
cns.figure(color_cycle="Science") # Science-inspired journal palette
cns.figure(color_cycle="Set1") # ColorBrewer Set1
# Sequential palettes (for continuous data)
cns.figure(color_map="parula") # MATLAB-style
cns.figure(color_map="gnuplot") # Default sequential
# Get individual colors
red = cns.RED
blue = cns.BLUE
```
### Statistical Tests
Many plot functions include built-in statistical testing:
```python
# Boxplot with Mann-Whitney U test
cns.boxplot(data=df, x="group", y="value", pairs="all")
# Barplot with Welch's t-test
cns.barplot(data=df, x="group", y="value", pairs=[("A", "B")])
# Stackplot with Fisher's exact test
cns.stackplot(data=df, x="group", y="category", pairs=[("A", "B")])
```
### Export for Publication
```python
# SVG for vector graphics (recommended)
cns.savefig("figure.svg")
# High-resolution PNG
cns.savefig("figure.png")
# PDF with editable text
cns.savefig("figure.pdf")
```
For Illustrator-optimized SVG post-processing, install MuPDF's `mutool`.
Without it, `cns.savefig("figure.svg")` falls back to a standard matplotlib SVG
and emits a warning instead of failing.
## Requirements
- Python ≥ 3.10
- Core: matplotlib, numpy, pandas, seaborn
- Included integrations: lifelines, gseapy, scanpy, and other plotting backends
- Optional external tool: MuPDF's `mutool` for enhanced SVG post-processing
See [pyproject.toml](pyproject.toml) for complete dependency list.
## Contributing
Contributions are welcome! Please feel free to submit a Pull Request. For major changes, please open an issue first to discuss what you would like to change.
## Citation
If you use cnsplots in your research, please cite:
```bibtex
@software{cnsplots,
author = {Rashidi, Farid},
title = {cnsplots: Publication-Ready Scientific Plots},
year = {2026},
url = {https://github.com/faridrashidi/cnsplots}
}
```
## License
This project is licensed under the BSD 3-Clause License - see the [LICENSE.md](LICENSE.md) file for details.
## Acknowledgments
Built with:
- [matplotlib](https://matplotlib.org/) - Core plotting library
- [seaborn](https://seaborn.pydata.org/) - Statistical visualizations
- [lifelines](https://lifelines.readthedocs.io/) - Survival analysis
- [PyComplexHeatmap](https://github.com/DingWB/PyComplexHeatmap) - Complex heatmaps
- [UpSetPlot](https://upsetplot.readthedocs.io/) - Set intersections
Inspired by the visualization standards of Cell, Nature, and Science journals.
## Support
- 📖 [Documentation](https://cnsplots.farid.one/)
- 🐛 [Issue Tracker](https://github.com/faridrashidi/cnsplots/issues)
- 💬 [Discussions](https://github.com/faridrashidi/cnsplots/discussions)
## Related Projects
- [matplotlib](https://matplotlib.org/) - The foundation of Python plotting
- [seaborn](https://seaborn.pydata.org/) - Statistical data visualization
- [plotnine](https://plotnine.readthedocs.io/) - Grammar of graphics for Python
- [altair](https://altair-viz.github.io/) - Declarative visualization
---
Made with ❤️ for the scientific community
[⭐ Star us on GitHub](https://github.com/faridrashidi/cnsplots) · [📖 Documentation](https://cnsplots.farid.one/)