https://github.com/fatihilhan42/starbucks_analysis_turkey_and_world_with_python
In this project, firstly the brands for coffee in the world and then these brands in Turkey were examined. The data from the dataset, which you can find in the repo, was first organized using data cleaning algorithms. These cleaned data were then graphically extracted using data visualization algorithms.
https://github.com/fatihilhan42/starbucks_analysis_turkey_and_world_with_python
data-analysis data-cleaning data-science data-visualization jupyter-notebook python
Last synced: about 2 months ago
JSON representation
In this project, firstly the brands for coffee in the world and then these brands in Turkey were examined. The data from the dataset, which you can find in the repo, was first organized using data cleaning algorithms. These cleaned data were then graphically extracted using data visualization algorithms.
- Host: GitHub
- URL: https://github.com/fatihilhan42/starbucks_analysis_turkey_and_world_with_python
- Owner: fatihilhan42
- Created: 2022-08-25T12:55:39.000Z (almost 4 years ago)
- Default Branch: main
- Last Pushed: 2022-08-25T12:55:47.000Z (almost 4 years ago)
- Last Synced: 2025-06-15T08:51:07.257Z (about 1 year ago)
- Topics: data-analysis, data-cleaning, data-science, data-visualization, jupyter-notebook, python
- Language: Jupyter Notebook
- Homepage:
- Size: 1.59 MB
- Stars: 0
- Watchers: 1
- Forks: 0
- Open Issues: 0
-
Metadata Files:
- Readme: README.md
Awesome Lists containing this project
README
# Starbucks Analysis Turkey and World
In this project, firstly the brands for coffee in the world and then these brands in Turkey were examined. The data from the dataset, which you can find in the repo, was first organized using data cleaning algorithms. These cleaned data were then graphically extracted using data visualization algorithms.
# Importing Libraries
```Python
import numpy as np
import pandas as pd
import seaborn as sns
from matplotlib import pyplot as plt
import warnings
from mpl_toolkits.basemap import Basemap
%matplotlib inline
sns.set(style="white", context="talk")
warnings.simplefilter(action='ignore', category=FutureWarning)
warnings.filterwarnings("ignore",category=plt.cbook.mplDeprecation)
```
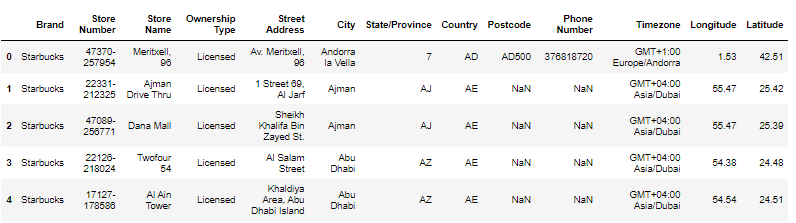
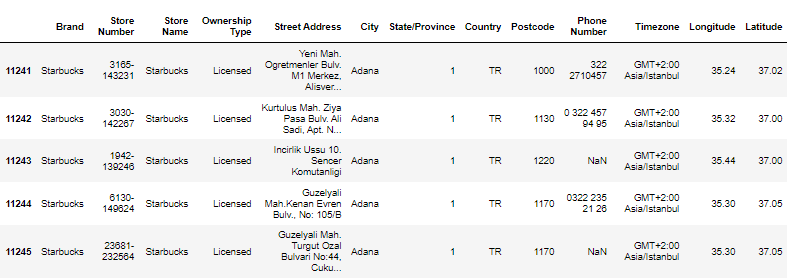
# Read Dataset(head)
```Python
data.head()
```
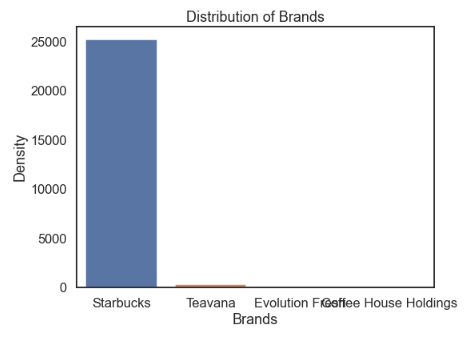
# How many brands are available in the data
## Distribution of Brands
```Python
x=data['Brand'].value_counts()
print(x)
plt.figure(figsize=(8, 6))
fig=sns.barplot(x.index,x.values)
plt.xlabel('Brands')
plt.ylabel('Density')
fig.set_title('Distribution of Brands')
```
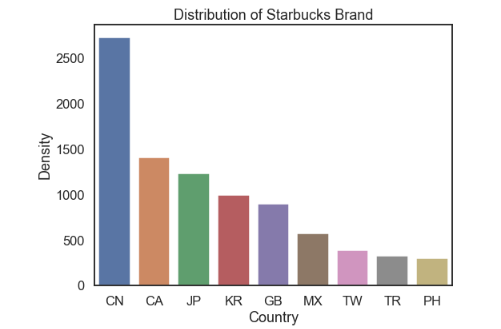
### Which country does 'Starbucks' brand use?
```Python
Starbucks=data[data['Brand']=='Starbucks']['Country'].value_counts()[1:10]
print(Starbucks)
plt.figure(figsize=(8, 6))
fig=sns.barplot(Starbucks.index,Starbucks.values)
plt.xlabel('Country')
plt.ylabel('Density')
fig.set_title('Distribution of Starbucks Brand')
```
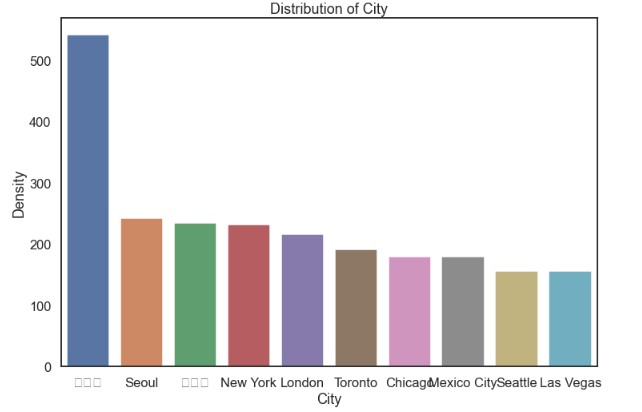
# How many cities are Starbucks stores available?
```Python
City=data['City'].value_counts()
print(City)
print('Total number of cities is',len(City))
plt.figure(figsize=(12,8))
fig=sns.barplot(City.index[:10],City.values[:10])
plt.xlabel('City')
plt.ylabel('Density')
fig.set_title('Distribution of City')
```
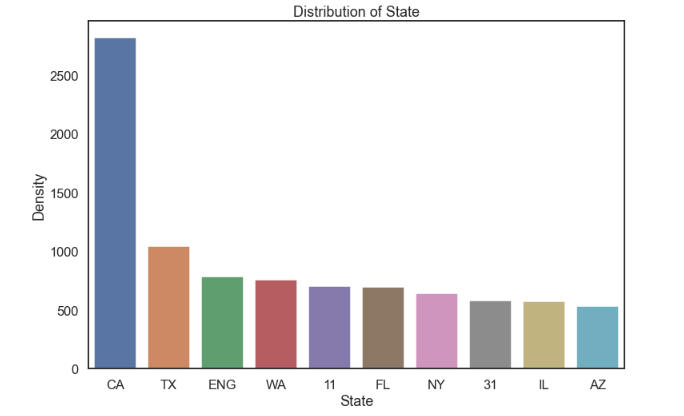
## How many state or province are Starbucks stores available?
```Python
State=data['State/Province'].value_counts()
print(State)
print('Total number of states is',len(State))
plt.figure(figsize=(12,8))
fig=sns.barplot(State.index[:10],State.values[:10])
plt.xlabel('State')
plt.ylabel('Density')
fig.set_title('Distribution of State')
```
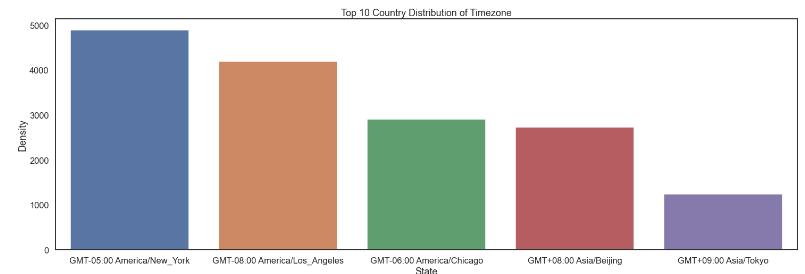
## Timezone
```Python
Timezone=data['Timezone'].value_counts()
print(Timezone)
print('Total number of timezone is',len(Timezone))
plt.figure(figsize=(25,8))
fig=sns.barplot(Timezone.index[:5],Timezone.values[:5])
plt.xlabel('State')
plt.ylabel('Density')
fig.set_title('Top 10 Country Distribution of Timezone')
```
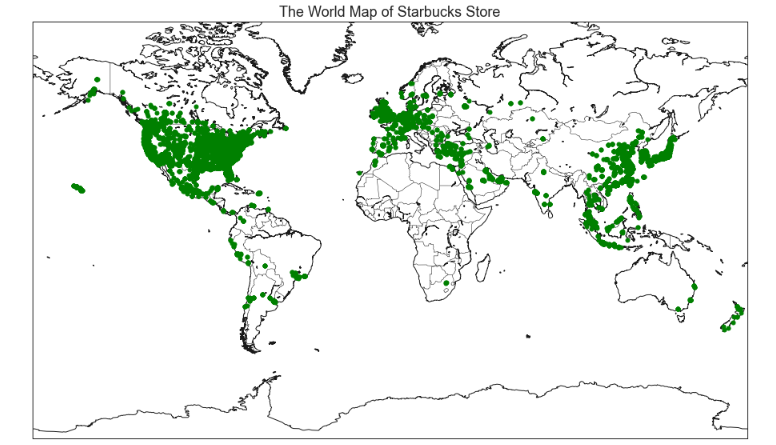
# World Map of Starbucks Store
```Python
plt.figure(figsize=(16,16))
worldmap = Basemap(projection='mill',
llcrnrlat=-80,
urcrnrlat=80,
llcrnrlon=-180,
urcrnrlon=180,
resolution='l')
worldmap.drawcoastlines()
worldmap.drawcountries()
worldmap.drawmapboundary(fill_color='white')
# Load in Longitude and Latitude data
Longitude = data["Longitude"].astype(float)
Latitude = data["Latitude"].astype(float)
x, y = worldmap(list(Longitude), list(Latitude))
worldmap.plot(x, y,'bo',markersize =5,color="green" )
plt.title('The World Map of Starbucks Store')
plt.show()
```
# Specific Approximation for Turkey Country
```Python
TurkeyData=data[data['Country']=='TR']
TurkeyData.head()
```
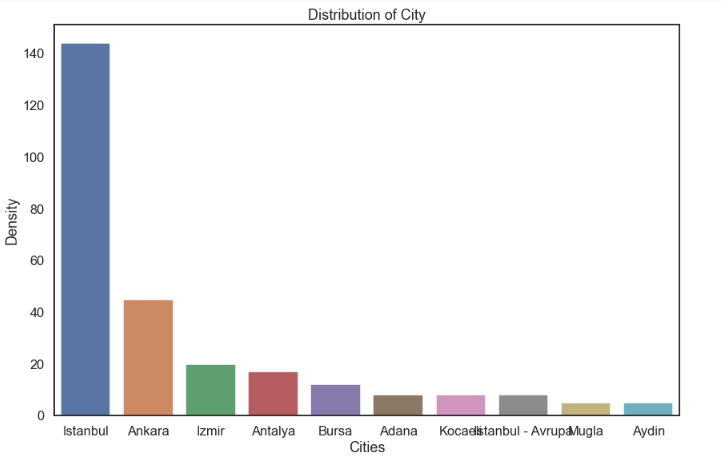
# Distribution of City
```Python
TurkeyCity=TurkeyData['City'].value_counts()
print('Total number of city is', len(TurkeyCity))
plt.figure(figsize=(14,9))
fig=sns.barplot(TurkeyCity.index[:10],TurkeyCity.values[:10])
plt.xlabel('Cities')
plt.ylabel('Density')
fig.set_title('Distribution of City')
```
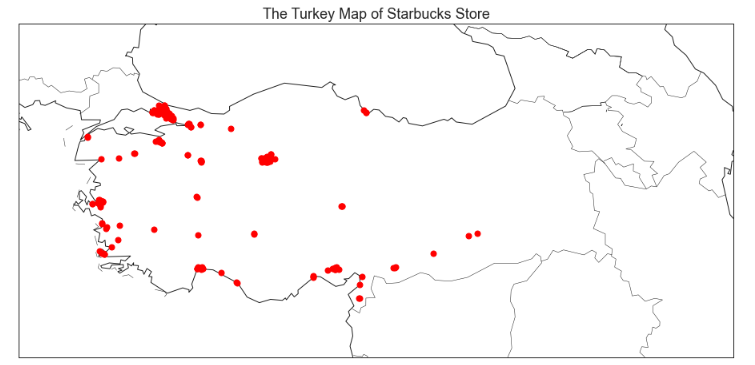
# Turkey Starbucks Map
```Python
plt.figure(figsize=(16,16))
map = Basemap(projection='stere',
lat_0=38, lon_0=37,
llcrnrlon=25,
llcrnrlat=34,
urcrnrlon=50,
urcrnrlat=43,resolution='l',area_thresh=10000,rsphere=6371200.)
map.drawcoastlines()
map.drawcountries()
map.drawmapboundary(fill_color='white')
# Load in Longitude and Latitude data
Longitude = TurkeyData["Longitude"].astype(float)
Latitude = TurkeyData["Latitude"].astype(float)
x, y = map(list(Longitude), list(Latitude))
map.plot(x, y,'bo',markersize =7,color="red" )
plt.title('The Turkey Map of Starbucks Store')
plt.show()
```
See you on another project.
## MAY THE FORCE BE WITH YOU!!!