https://github.com/favourdaniel/monitor-flask-app-metrics-with-prometheus-format
https://github.com/favourdaniel/monitor-flask-app-metrics-with-prometheus-format
Last synced: over 1 year ago
JSON representation
- Host: GitHub
- URL: https://github.com/favourdaniel/monitor-flask-app-metrics-with-prometheus-format
- Owner: FavourDaniel
- Created: 2023-11-22T12:47:39.000Z (over 2 years ago)
- Default Branch: main
- Last Pushed: 2023-11-27T05:39:58.000Z (over 2 years ago)
- Last Synced: 2025-02-07T21:41:25.546Z (over 1 year ago)
- Language: Python
- Size: 3.91 KB
- Stars: 0
- Watchers: 1
- Forks: 1
- Open Issues: 0
-
Metadata Files:
- Readme: README.md
Awesome Lists containing this project
README
# Monitor-Flask-App-metrics-with-Prometheus-format
This is a simple Flask application that exposes metrics in Prometheus format using the [prometheus_flask_exporter](https://github.com/rycus86/prometheus_flask_exporter).
To run the app, you need to have Python and pip installed on your machine, then install the required dependencies.
## Steps to run Flask app
1. Activate your virtual environment (if not already activated)
```
source venv/bin/activate # On macOS or Linux
```
2. Install required packages
```
python -m pip install flask prometheus_flask_exporter
python -m pip install requests
```
3. Start the flask application
```
python app.py
```
The different endpoints for the application are `127.0.0.1:5000/one`, `127.0.0.1:5000/two`, `127.0.0.1:5000/three`, `127.0.0.1:5000/four` and `127.0.0.1:5000/error`.
4. In a new terminal, start the generator
```
python app-generator.py
```
It will be used in generating request for the Flask application at the different endpoints.
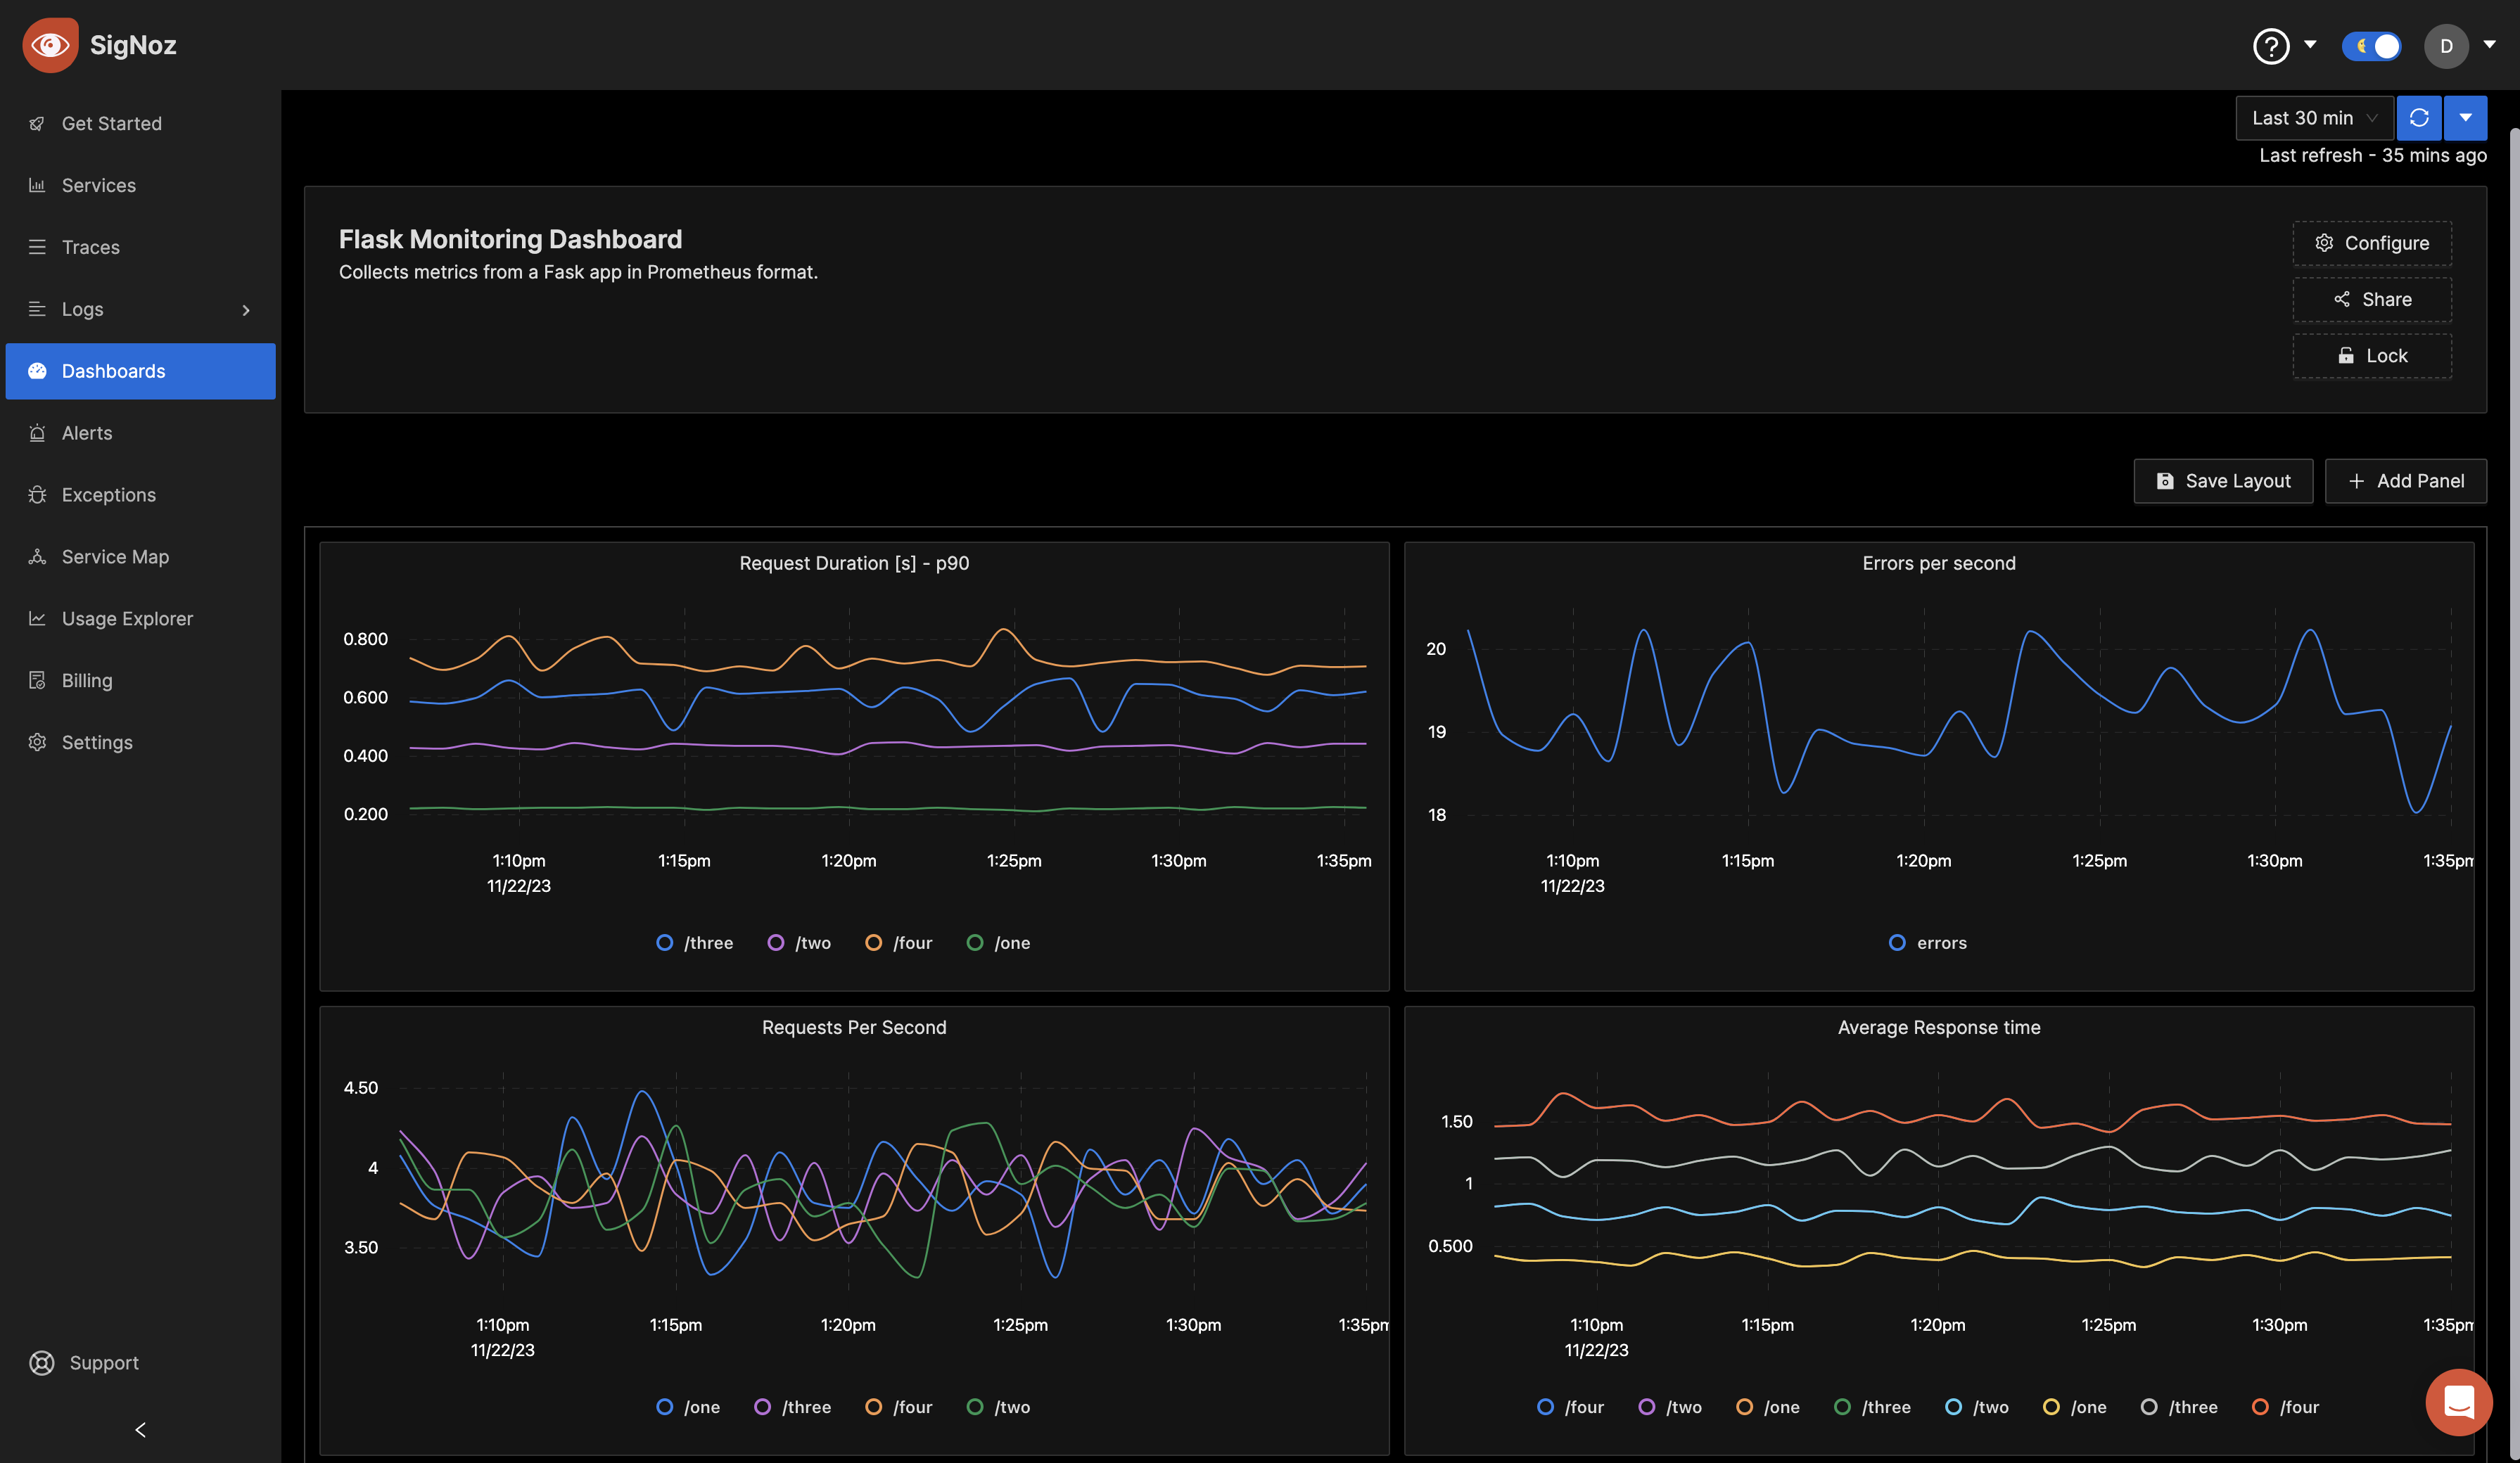
5. Send the metrics to a monitoring tool for visualization. You can do this with OpenTelemetry and SigNoz, read the article [here](https://signoz.io/blog/opentelemetry-collector-prometheus-receiver/).