https://github.com/feathers-studio/wiretap
Extremely tiny debug logging utility for all JavaScript runtimes.
https://github.com/feathers-studio/wiretap
Last synced: 9 months ago
JSON representation
Extremely tiny debug logging utility for all JavaScript runtimes.
- Host: GitHub
- URL: https://github.com/feathers-studio/wiretap
- Owner: feathers-studio
- License: mit
- Created: 2025-03-27T13:18:06.000Z (9 months ago)
- Default Branch: master
- Last Pushed: 2025-03-27T15:02:52.000Z (9 months ago)
- Last Synced: 2025-03-27T15:44:55.097Z (9 months ago)
- Language: TypeScript
- Size: 14.6 KB
- Stars: 0
- Watchers: 1
- Forks: 0
- Open Issues: 0
-
Metadata Files:
- Readme: README.md
- License: LICENSE
Awesome Lists containing this project
README

wiretap
Extremely tiny debug logging utility for all JavaScript runtimes.
Inspired by [`debug`](https://npmjs.com/package/debug), but very small and portable.
## Installation
```sh
# npm
npm install w
# yarn
yarn add w
# pnpm
pnpm add w
# bun
bun add w
# deno
deno add jsr:@mkr/wiretap
```
## Quick Start
```ts
import { w } from "w";
```
```ts
const log = w("app:main");
log("Creating new user", { email: req.body.email });
```
```ts
const log = w("app:auth");
log("User authentication failed", { email: req.body.email });
```
If you're a library author, we recommend using your library's name as part of your namespace.
## Usage
All debug logs are disabled by default, and can be enabled by setting the `DEBUG` environment variable.
```sh
> DEBUG=app:main node index.js
app:main Creating new user { email: 'a@test.com' }
```
To enable all logs at any level, use `*`. Naturally `DEBUG=*` will enable all logs at all levels.
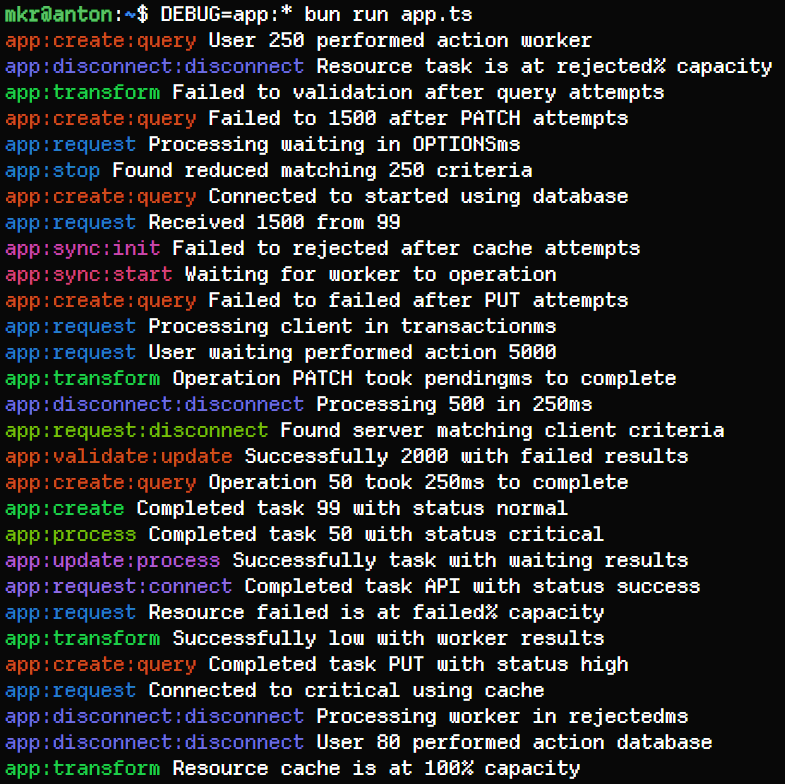
```sh
> DEBUG=app:* node index.js
app:main Creating new user { email: 'a@test.com' }
app:auth User authentication failed { email: 'b@test.com' }
```
Multiple namespaces can be specified by separating them with commas:
```sh
> DEBUG=app:main,app:auth node index.js
app:main Creating new user { email: 'a@test.com' }
app:auth User authentication failed { email: 'b@test.com' }
```
To disable a specific level, prefix the spec with a `-`:
```sh
# all "app" enabled except "app:auth"
> DEBUG=app:*,-app:auth node index.js
app:main Creating new user { email: 'a@test.com' }
```
> 🔔 The most specific rule always wins.
>
> Example: `app:*,-app:auth,app:auth:warning`
>
> Explanation:
>
> - all namespaces under app are enabled
> - but app:auth is disabled
> - but app:auth:warning is enabled
>
> ```sh
> # notice that we didn't get app:auth, but we did get app:auth:warning
> > DEBUG=app:*,-app:auth,app:auth:warning node index.js
> app:main Creating new user { email: 'a@test.com' }
> app:auth:warning User authentication failed { email: 'b@test.com' }
> ```
### Panic
Each logger instance includes a `panic` method that can be used for critical errors that should halt execution completely:
```ts
const log = w("app:critical");
log.panic("Fatal error occurred", { error }); // This will never return
```
By default, panic will:
1. Log the error message to stderr
2. Print a stack trace
3. Trigger a debugger break
4. Attempt to exit the process or show an alert (in browsers)
5. Fallback to infinite loop
You can configure panic to throw an error instead by setting the `W_PANIC_THROWS=1` environment variable.
### Programmatic Control
An individual logger instance can also be enabled or disabled programmatically:
```ts
const log = w("app:feature");
// Enable this logger regardless of DEBUG environment
log.enabled = true;
// Disable this logger regardless of DEBUG environment
log.enabled = false;
```
By default, `w`iretap will log to stderr. You can customise the logger function used:
```ts
const log = w("app:custom");
// Replace the default logger with your own
log.logger = console.log.bind(console); // or
log.logger = (...args) => console.log("[CUSTOM]", ...args);
```
### Colour Configuration
By default, `w`iretap will use colours in environments that support it. `w`iretap will read the following environment variables (in order of precedence):
- `FORCE_COLOR`: Force enable coloured output
- `NO_COLOR`: Disable coloured output
- `CI`: Disable coloured output in CI environments
## Supported Environments:
- Node.js
- Bun
- Deno
- Cloudflare Workers
- Browsers (by default, you _may_ need to turn on the "debug", "verbose", or similar setting in the console to see the logs in your browser to see debug logs)