https://github.com/fferegrino/hubify
Create GitHub-like visualisations of your time series data
https://github.com/fferegrino/hubify
github matplotlib plot python timeseries
Last synced: 3 months ago
JSON representation
Create GitHub-like visualisations of your time series data
- Host: GitHub
- URL: https://github.com/fferegrino/hubify
- Owner: fferegrino
- Created: 2022-06-07T16:09:44.000Z (about 4 years ago)
- Default Branch: main
- Last Pushed: 2022-07-26T05:55:58.000Z (almost 4 years ago)
- Last Synced: 2025-03-08T10:47:24.082Z (over 1 year ago)
- Topics: github, matplotlib, plot, python, timeseries
- Language: Python
- Homepage:
- Size: 92.8 KB
- Stars: 0
- Watchers: 2
- Forks: 0
- Open Issues: 0
-
Metadata Files:
- Readme: readme.md
Awesome Lists containing this project
README
hubify
======
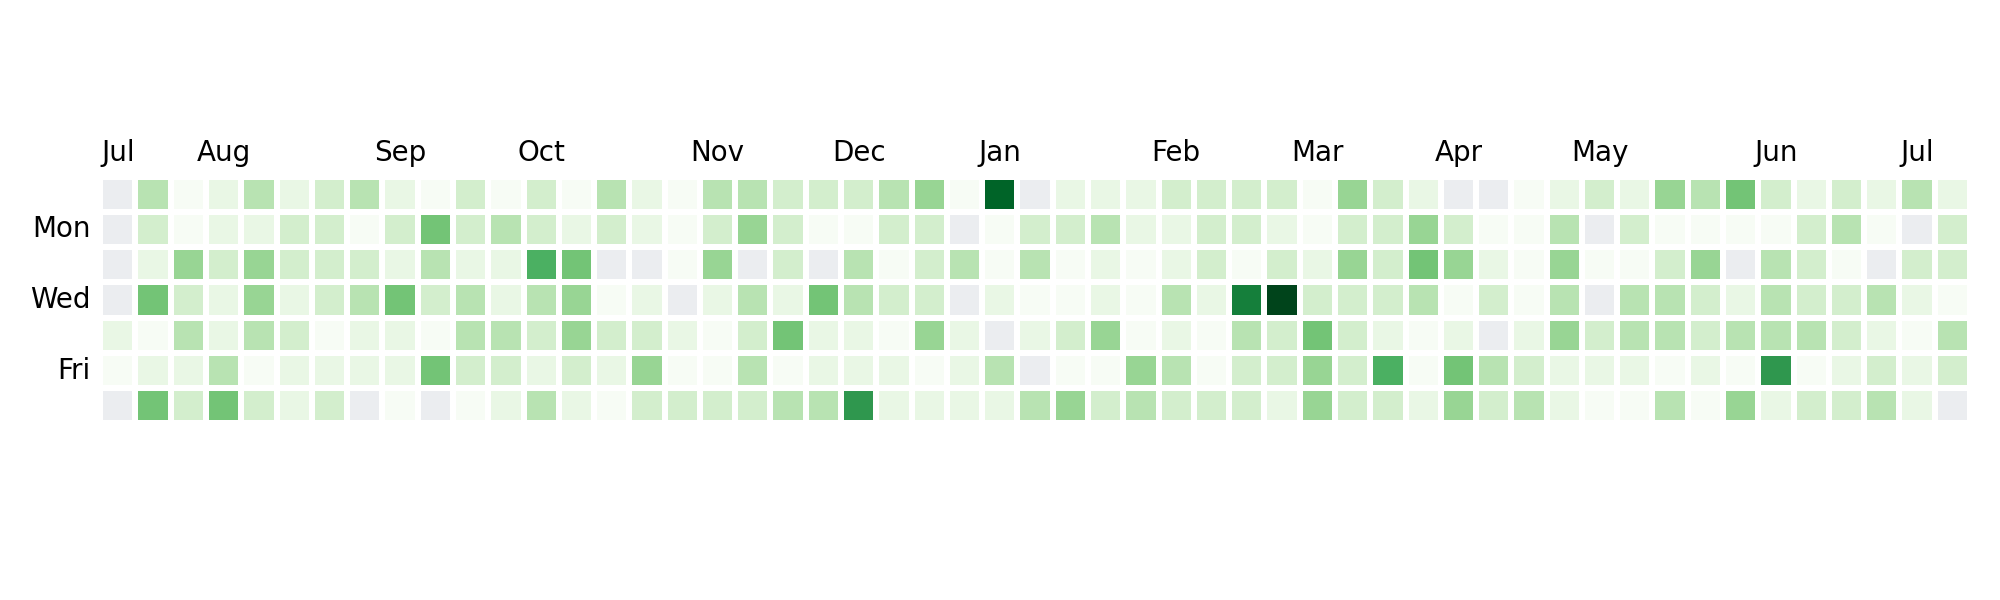
Create GitHub-like visualisations from your time series data.
## Basic Usage
```python
# A list of datetimes, where each datetime represents an observation
from datetime import datetime, timedelta
import random
# Import Hubify
from hubify import hubify
# Set a seed
random.seed(42)
# Create 400 random events
events = [
datetime.today() - timedelta(days=random.randint(0, 365))
for _ in range(400)
]
# Call hubify
hubify(events)
```
You should see something like this
## Installation
```shell
pip install hubify
```