https://github.com/flexmonster/js-pivot-table
JavaScript Pivot table & Charts by Flexmonster
https://github.com/flexmonster/js-pivot-table
aggregation crosstab javascript library pivot-chart pivot-grid pivot-tables
Last synced: over 1 year ago
JSON representation
JavaScript Pivot table & Charts by Flexmonster
- Host: GitHub
- URL: https://github.com/flexmonster/js-pivot-table
- Owner: flexmonster
- License: other
- Created: 2016-11-11T15:29:29.000Z (over 9 years ago)
- Default Branch: master
- Last Pushed: 2023-08-17T08:56:18.000Z (almost 3 years ago)
- Last Synced: 2025-03-03T10:26:08.751Z (over 1 year ago)
- Topics: aggregation, crosstab, javascript, library, pivot-chart, pivot-grid, pivot-tables
- Homepage: https://flexmonster.com
- Size: 32.2 KB
- Stars: 10
- Watchers: 3
- Forks: 0
- Open Issues: 0
-
Metadata Files:
- Readme: README.md
- License: LICENSE.md
Awesome Lists containing this project
README
# Flexmonster Pivot Table & Charts
[](https://www.flexmonster.com/?r=github)
Website: [www.flexmonster.com](https://www.flexmonster.com/?r=github)
## What is JS Pivot Table by Flexmonster?
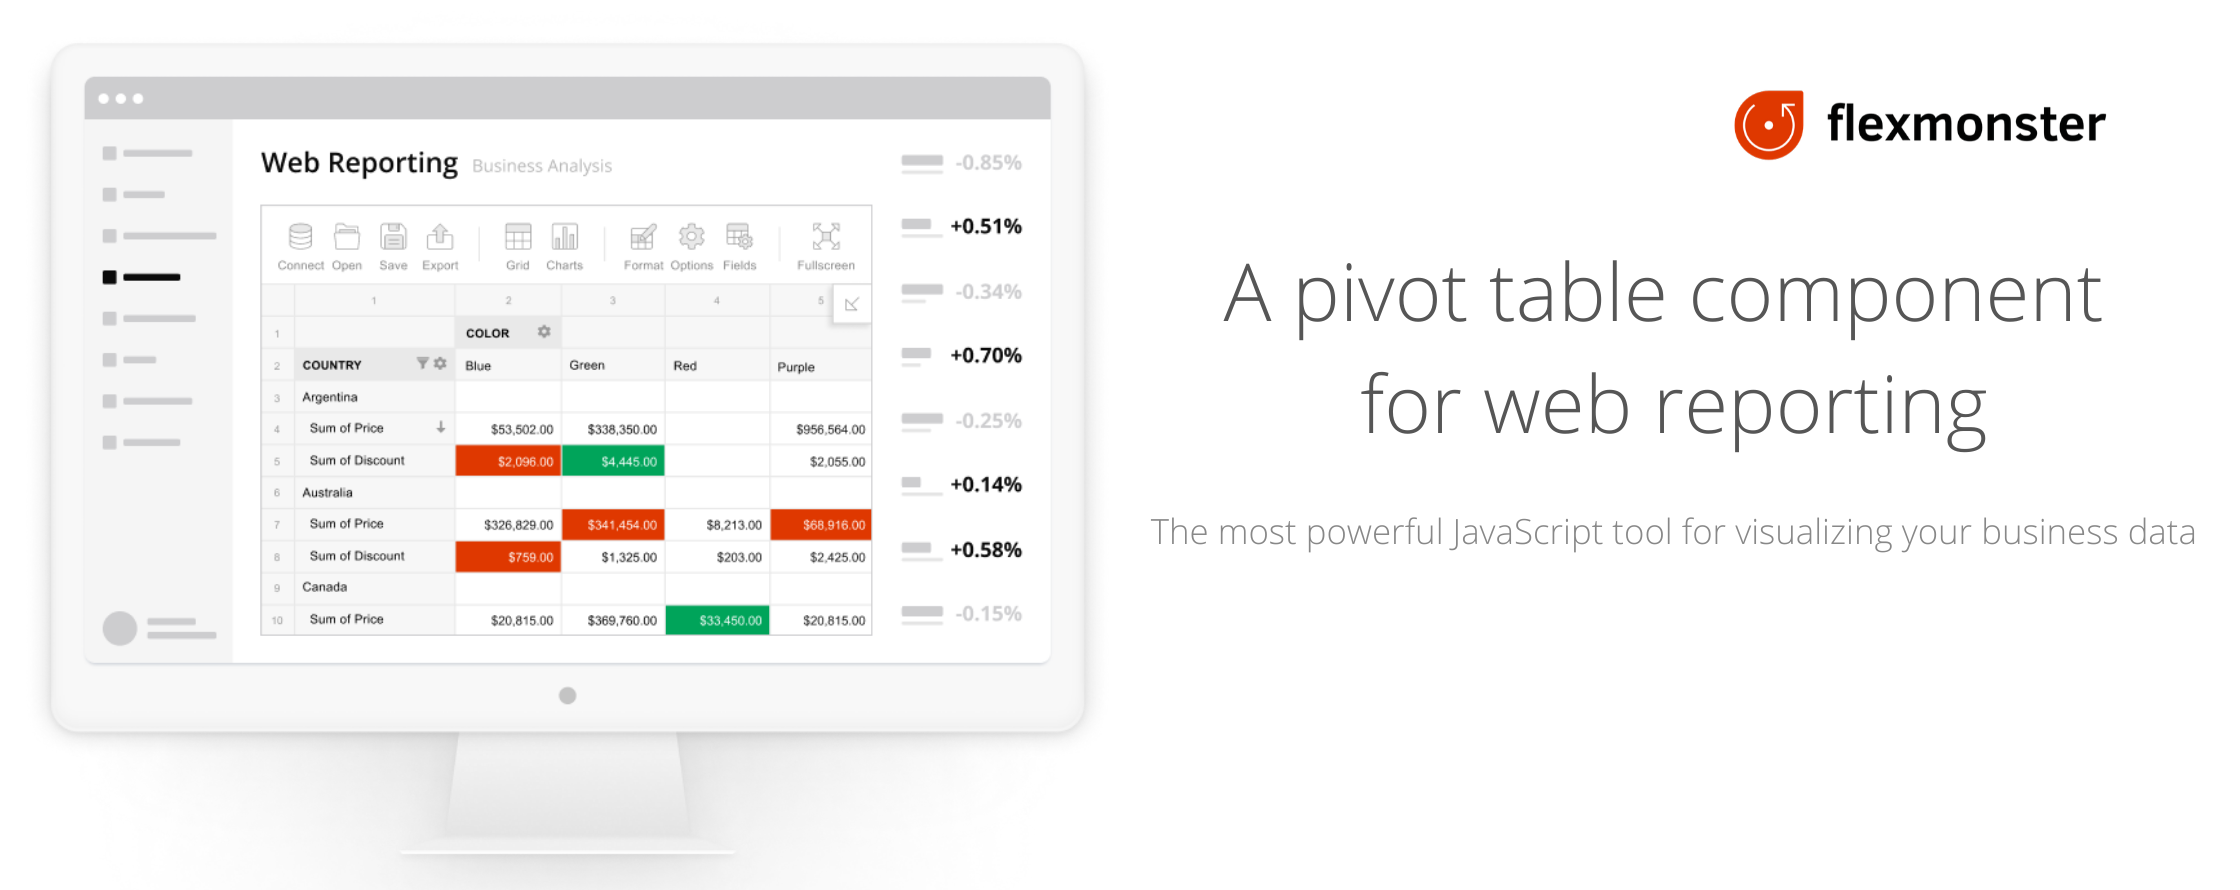
Flexmonster Pivot Table & Charts is a component for interactive pivot reports that can be [inserted to a web page or a web application](https://www.flexmonster.com/demos/js/pivot-table/?r=github). It’s a powerful JavaScript tool to visualize your business data.
With Flexmonster, you have no limitation on server-side technology, no matter whether your website runs on .NET, Java, PHP, Ruby, etc.
## Why use Flexmonster Pivot Table & Charts?
### Easy to integrate
Flexmonster Pivot Table & Charts can be natively used with JavaScript or [TypeScript](https://www.flexmonster.com/doc/integration-with-typescript/?r=github). It perfectly integrates with [Angular](https://www.flexmonster.com/doc/integration-with-angular/?r=github), [React](https://www.flexmonster.com/doc/integration-with-react/?r=github), [Vue](https://www.flexmonster.com/doc/integration-with-vue-3/?r=github), and many other frameworks - see our [Integration with frameworks](https://www.flexmonster.com/doc/available-tutorials-integration/?r=github) section.
### Supports the most common data sources
- [JSON](https://www.flexmonster.com/doc/json-data-source/?r=github)
- [CSV](https://www.flexmonster.com/doc/csv-data-source/?r=github)
- [SQL databases](https://www.flexmonster.com/doc/connect-to-relational-database/?r=github) (MS SQL, MySQL, and others)
- [Microsoft Analysis Services OLAP cubes](https://www.flexmonster.com/doc/connecting-to-microsoft-analysis-services/?r=github)
- [Custom data source API](https://www.flexmonster.com/doc/introduction-to-custom-data-source-api/?r=github)
- [Elasticsearch](https://www.flexmonster.com/doc/connecting-to-elasticsearch/?r=github)
### High speed in visualizing your data
Our solution allows you to work extremely fast with really large data volumes (huge OLAP cubes, datasets from SQL databases, or files up to 100MB). The maximum data size is limited only by end-user browsers and the capacity of their devices. The table renders multiple millions of cells immediately. If the user’s browser can handle it, we’ll display it.
To gain even better performance while working with JSON, CSV, and datasets from SQL databases, use [Flexmonster Data Server](https://www.flexmonster.com/doc/intro-to-flexmonster-data-server/?r=github) - a special server developed by Flexmonster. It fetches data from a data source, processes, aggregates it, and then passes to Flexmonster Pivot in a ready-to-show format. The Data Server significantly reduces data loading time and allows you to analyze large datasets (CSV and JSON files more than 1 GB).
Working with OLAP cubes, a browser component can communicate with the server via XMLA protocol, or you can use [Flexmonster Accelerator for OLAP cubes](https://www.flexmonster.com/doc/getting-started-with-accelerator-ssas/?r=github). It’s a special server-side proxy that helps you increase data loading speed from the server to the user’s browser tenfold.
### Smart features to analyze and manage your data
Flexmonster Pivot Table & Charts provides Excel-like features that give users the interface they have always used. The users can easily and quickly analyze data and produce a report using different options such as:
- Filtering
- Sorting
- Grouping fields in rows and columns
- Drill-down
- Drill-through
- Calculated fields
- Number formatting
- Aggregations
- Conditional formatting
Learn more about [report configuration](https://www.flexmonster.com/doc/available-tutorials-report/?r=github).
## Customizable & flexible
### Extensive API
The component has a convenient full-functional JavaScript API to embed the component into web applications. Being a developer, you can:
- Define what features you want to enable/disable
- Build your own scenarios around the component
[API Reference](https://www.flexmonster.com/api/?r=github)
### Localizing component
Localize Flexmonster Pivot Table & Charts easily using the prepared JSON files:
- [English (default)](https://github.com/flexmonster/pivot-localizations/blob/master/en.json)
- [Spanish](https://github.com/flexmonster/pivot-localizations/blob/master/es.json)
- [French](https://github.com/flexmonster/pivot-localizations/blob/master/fr.json)
- [Chinese](https://github.com/flexmonster/pivot-localizations/blob/master/zh.json)
- [Hungarian](https://github.com/flexmonster/pivot-localizations/blob/master/hu.json)
- [Italian](https://github.com/flexmonster/pivot-localizations/blob/master/it.json)
- [Portuguese](https://github.com/flexmonster/pivot-localizations/blob/master/pt.json)
- [Ukrainian](https://github.com/flexmonster/pivot-localizations/blob/master/uk.json)
- [German](https://github.com/flexmonster/pivot-localizations/blob/master/de.json)
- [Dutch](https://github.com/flexmonster/pivot-localizations/blob/master/nl.json)
- [Turkish](https://github.com/flexmonster/pivot-localizations/blob/master/tr.json)
You can also create a custom localization file. Our [guide on localization](https://www.flexmonster.com/doc/localizing-component/?r=github) gives more details about localizing Flexmonster.
### Compose report layout
Select which dimensions & values to show.
Users can easily change a report layout visually and examine the data from a different perspective. It allows you to stop guessing all possible report scenarios your end-users might require. The user will be able to tune it to their needs on the fly.
### Save & load reports
Users can create reports, save them to their local drive or the server, and load previously saved reports with the same configurations.
### Export & print
All table views (compact/classic/flat) and charts can be [exported](https://www.flexmonster.com/doc/export-report/?r=github) or [printed](https://www.flexmonster.com/doc/print-report/?r=github). Users can export the reports into a variety of formats:
- Microsoft Excel 7
- PDF
- HTML page
- CSV (comma-separated text format)
- Image (PNG)
You can control where to save the export data:
- to the local computer
- to the server (to remote file storage or database)
## Resources
- [Demos](https://www.flexmonster.com/demos/js/pivot-table/?r=github)
- [Documentation](https://www.flexmonster.com/doc/?r=github)
- [API reference](https://www.flexmonster.com/api/?r=github)
- [User interface](https://www.flexmonster.com/user-interface/?r=github)
- [Blog](https://www.flexmonster.com/blog/?r=github)
You can also get support from our Tech team by raising a ticket via [Flexmonster Help Center](https://www.flexmonster.com/help-center/?r=github).
## How to get Flexmonster Pivot?
[Download free trial](https://www.flexmonster.com/download-page/?r=github)