https://github.com/framsouza/eck-fleet-and-elastic-agent
Running Fleet & Elastic agent on ECK (7.14.0)
https://github.com/framsouza/eck-fleet-and-elastic-agent
Last synced: 27 days ago
JSON representation
Running Fleet & Elastic agent on ECK (7.14.0)
- Host: GitHub
- URL: https://github.com/framsouza/eck-fleet-and-elastic-agent
- Owner: framsouza
- Created: 2021-08-22T20:26:17.000Z (almost 5 years ago)
- Default Branch: main
- Last Pushed: 2021-09-01T10:43:31.000Z (almost 5 years ago)
- Last Synced: 2025-07-10T13:43:01.346Z (11 months ago)
- Size: 9.77 KB
- Stars: 3
- Watchers: 1
- Forks: 0
- Open Issues: 0
-
Metadata Files:
- Readme: README.md
Awesome Lists containing this project
README
# eck-fleet-and-elastic-agent
This page will guide you through how to configure elastic agent with fleet managed mode using ECK.
Elastic agent is a unified way to collect logs and metrics and ship them to elasticsearch, basically, instead of configuring filebeat and metricbeat, you can now choose by install only Elastic agent in your host.
On the other hand, Fleet is a Kibana UI to add and manage elastic agents.
## Jumping into it
First thing first, let's deploy our elasticsearch cluster by applying the [es.yml](https://github.com/framsouza/eck-fleet-and-elastic-agent/blob/main/es.yml) file.
There's nothing to care about on this manifest, this is pretty straightforward, contains only the resource request/limit (very important to set it) and the vm.max_map_count adjustment.
Next step is deploy Kibana by applying the [kibana.yml](https://github.com/framsouza/eck-fleet-and-elastic-agent/blob/main/kibana.yml). There are two lines to pay attention here:
```
xpack.fleet.agents.elasticsearch.host: "https://cluster1-es-http.default.svc:9200"
xpack.fleet.agents.fleet_server.hosts: ["https://fleet-server-agent-http.default.svc:8220"]
```
Those lines are required to properly configure Fleet.
`xpack.fleet.agents.elasticsearch.host` must point to elasticsearch cluster where the elastic agent will ship the data.
`xpack.fleet.agents.fleet_server.hosts` must point to Fleet Server that Elastic Agent should connect to.
No worries, once you deploy Fleet Server a Kubernetes service will be automatically created, then you should use it on the `xpack.fleet.agents.fleet_server.hosts` configuration.
Once you have elasticsearch & kibana up and running, we can now deploy first the serviceaccount & cluster rules by applying the [clusterroles.yml](https://github.com/framsouza/eck-fleet-and-elastic-agent/blob/main/clusterroles.yml) and then the Fleet server by applying the [fleet.yml](https://github.com/framsouza/eck-fleet-and-elastic-agent/blob/main/fleet.yml)
There are some important things to take into consideration in this file. First things first, make sure to properly configure the `kibanaRef` and `elasticsearchRefs` .
As we are using Fleet, the `mode` configuration must be `fleet`, and to make it works as a Fleet server instead of agent, you must add the line `fleetServerEnabled: true`, if you don't add it, it will work as a elastic agent.
We are deploying only 1 replica (which is enough for this test but you may increase it to handle your workload) and defining the serviceaccount permission to be able to access the Kubernetes resources.
Once we have the fleet server up and running (you can check it by looking into the pod logs _kubectl logs deploy/fleet-server-agent_ or checking the resource status by running _kubectl get agents_) let's deploy the elastic agent that will be managed by Fleet by applying the [elastic-agent.yml](https://github.com/framsouza/eck-fleet-and-elastic-agent/blob/main/elastic-agent.yml) manifest.
You can deploy it as daemonset or deployment, in this case, we are going to use daemonset because we want to collect Kubernetes metrics from every single node.
As well as the Fleet server, we must specify the `kibanaRef`. We also need to specify the fleet server ref (instead of elasticsearchRef) using the `fleetServerRef` (you can check the name by running _kubectl get agents_).
The way we know this is agent is by using only the `mode : fleet`, it will make it works by an agent.
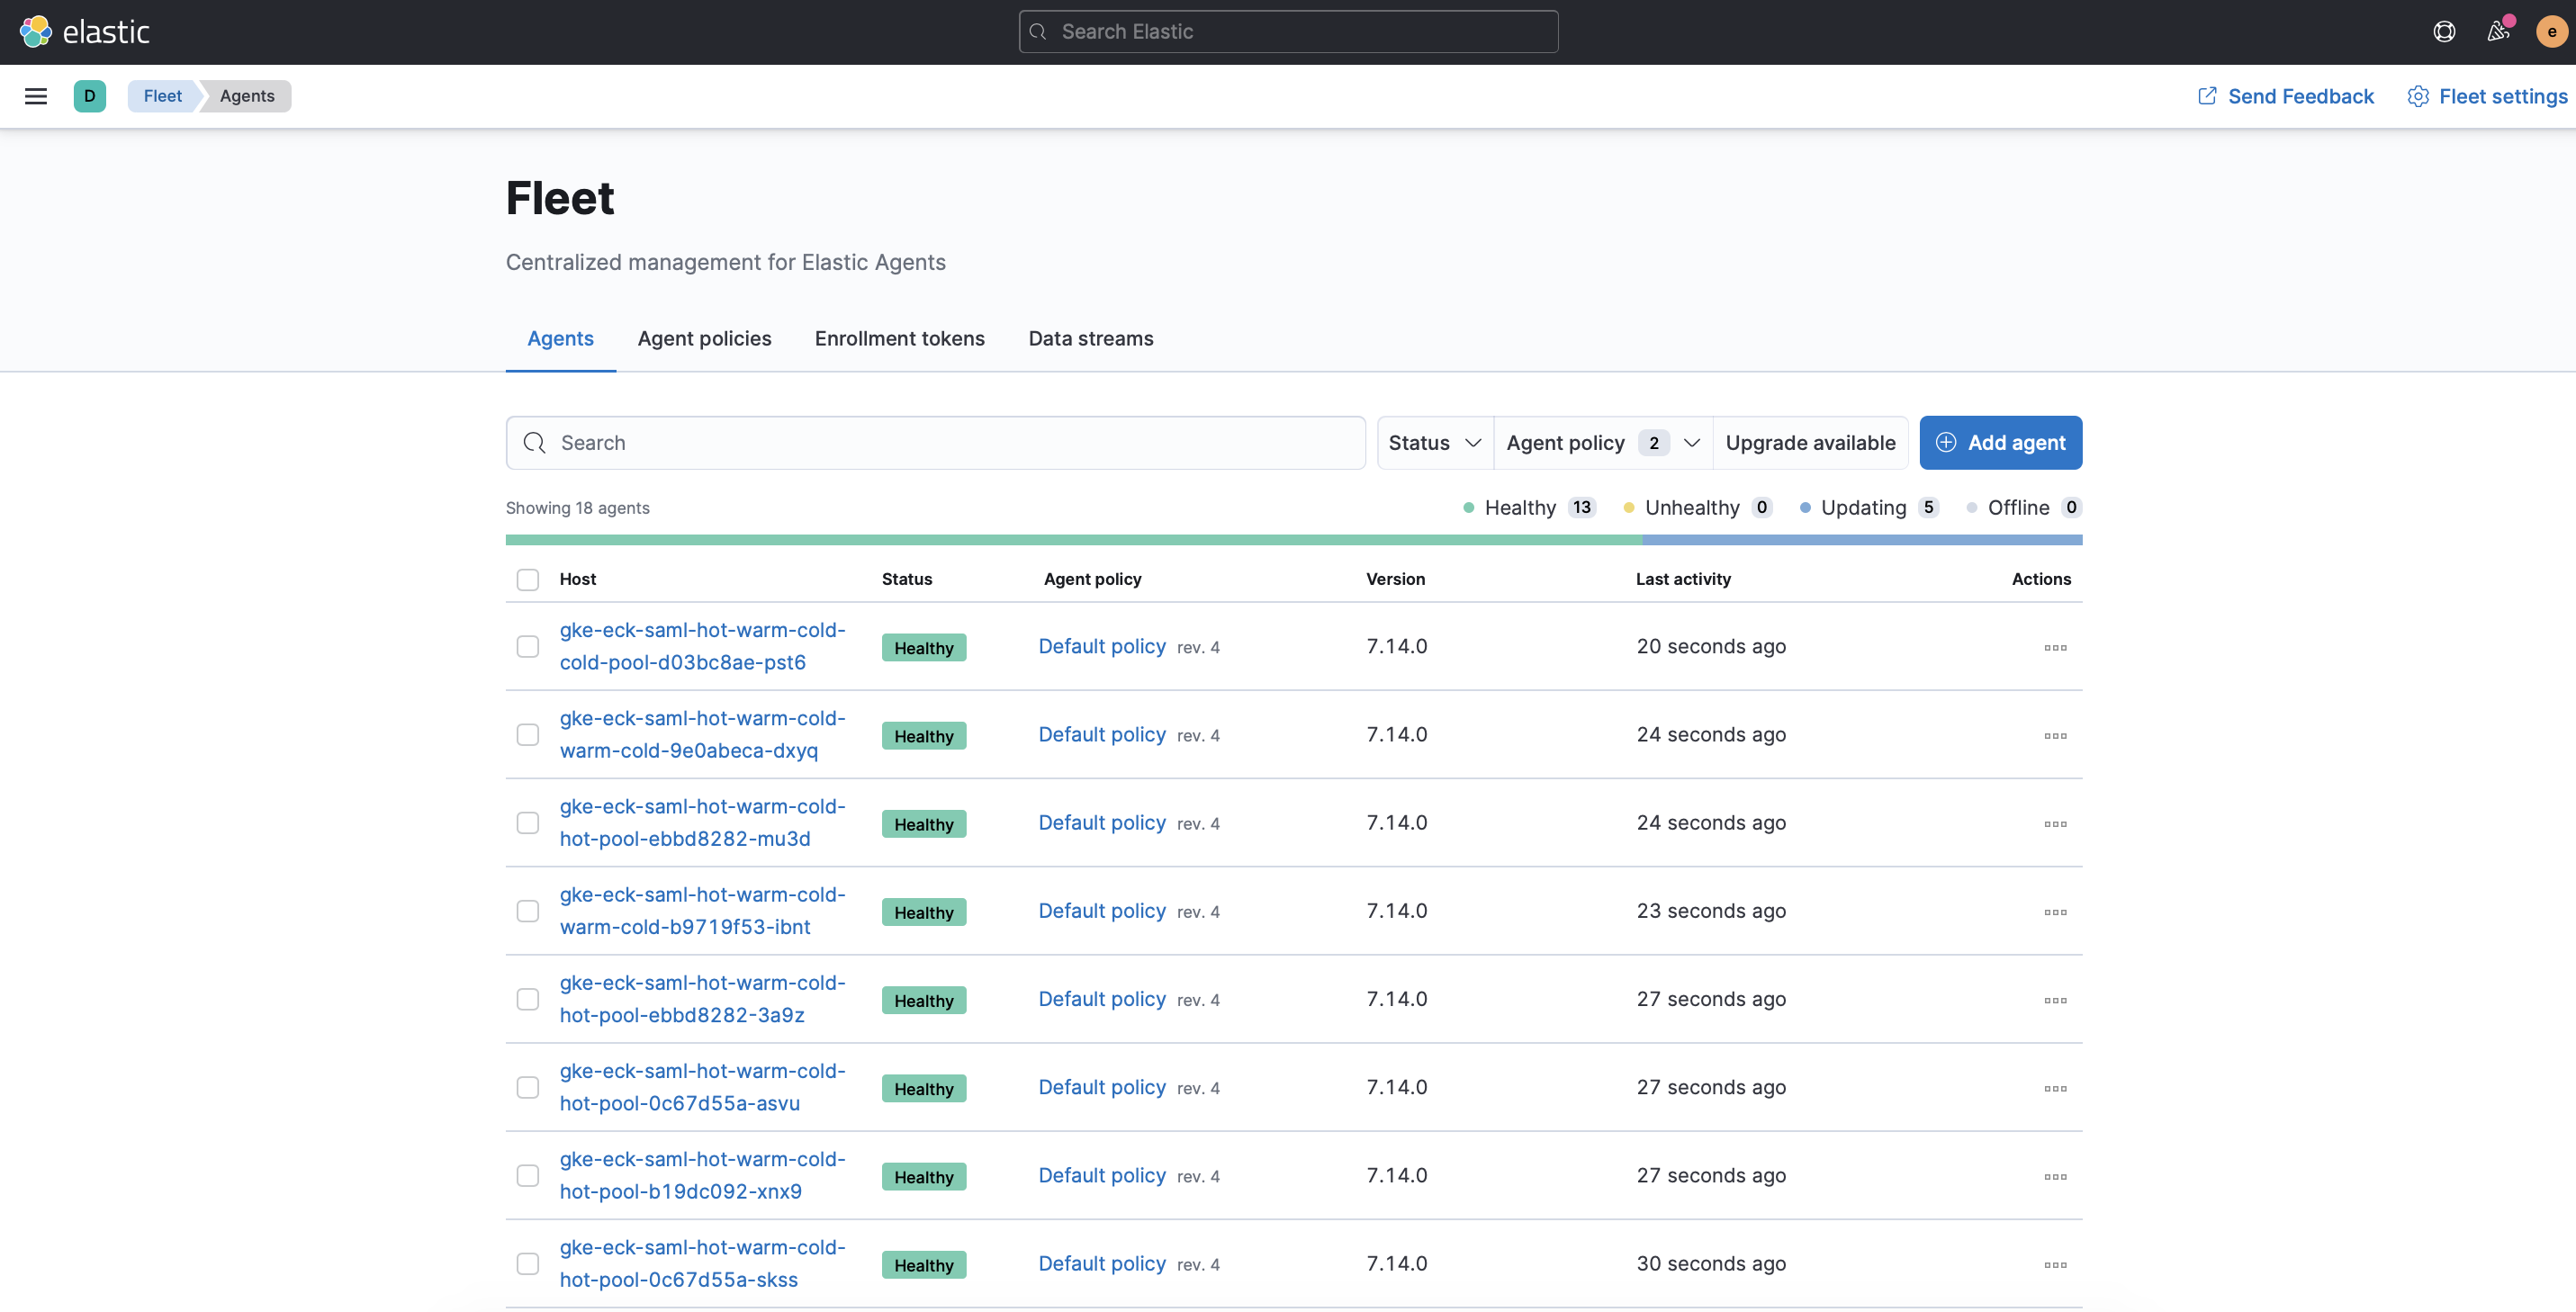
Once you deploy it, you can access Kibana and go to Fleet and you will see something similar to that:
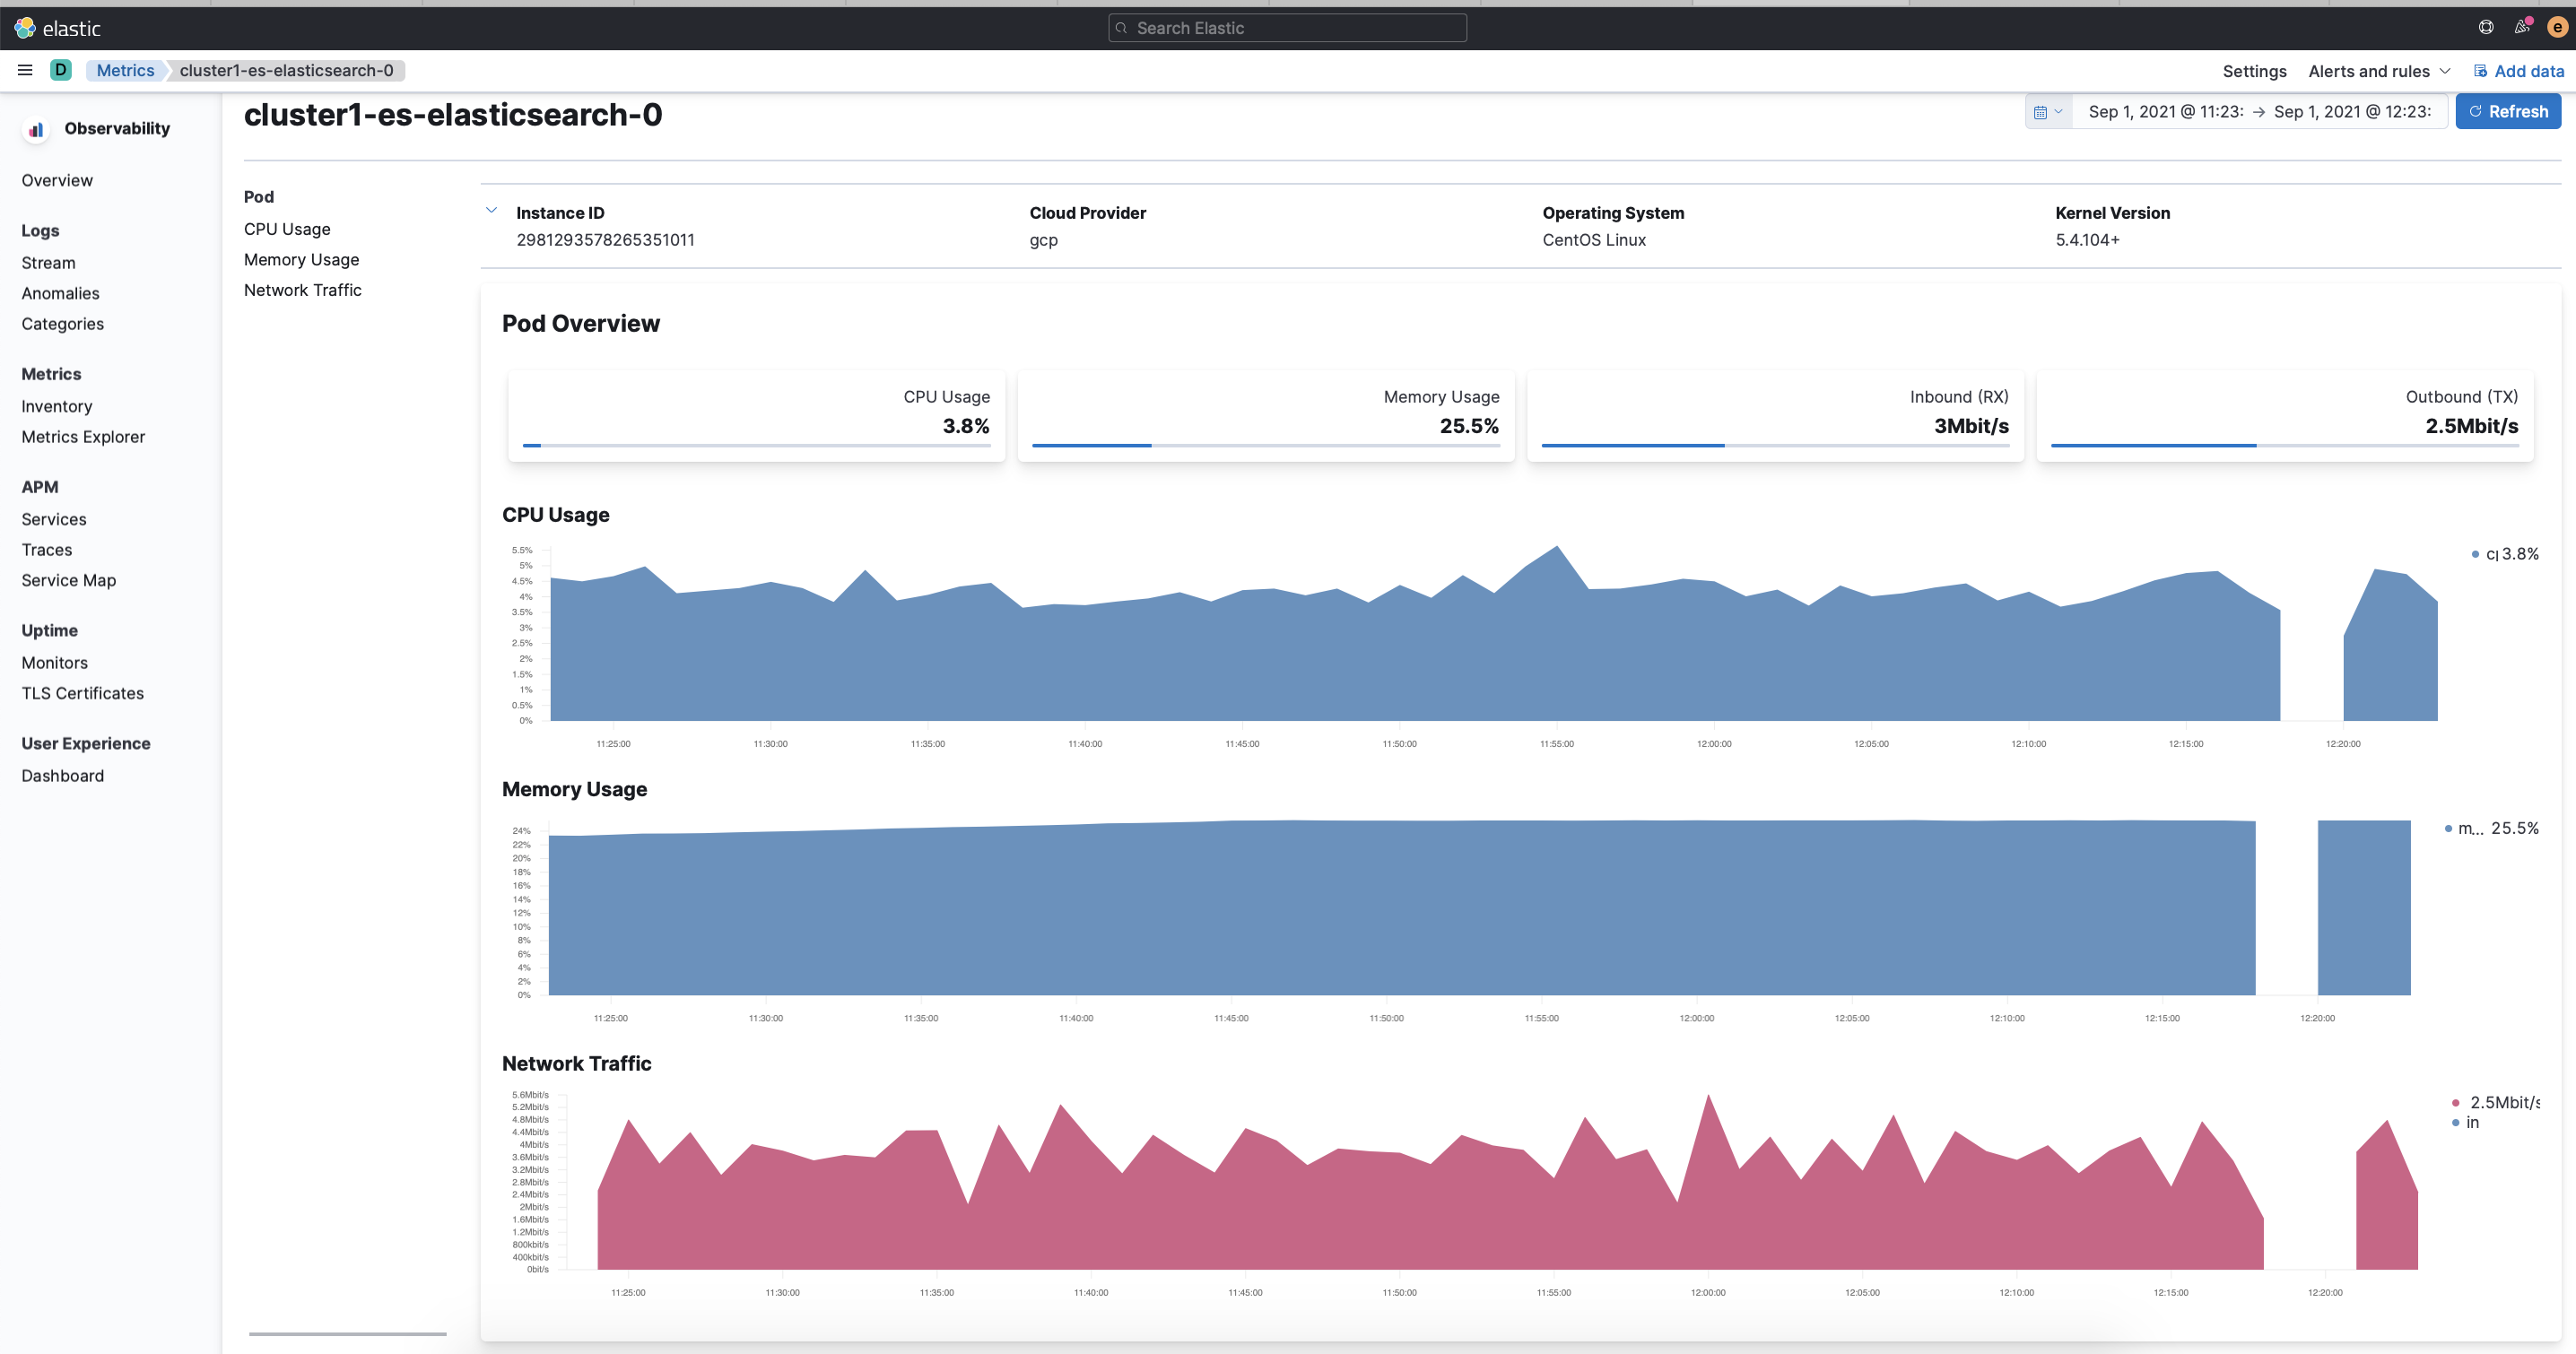
You can then access the Default policy and add the Kubernetes integration, once this is added and updated in every single agent you can access the Metric inventory and check the Kubernetes pods metrics like that:
Quite easy, right? ;)
I hope this helps you