https://github.com/franfj/vtk-geopotential-data
Project done for the 'Interactive and Visualization Systems' subject, belonging to the Master's Degree in Computer Security Engineering and Artificial Intelligence
https://github.com/franfj/vtk-geopotential-data
jupyter-notebook sciviews vtk vtk-applications
Last synced: 4 months ago
JSON representation
Project done for the 'Interactive and Visualization Systems' subject, belonging to the Master's Degree in Computer Security Engineering and Artificial Intelligence
- Host: GitHub
- URL: https://github.com/franfj/vtk-geopotential-data
- Owner: franfj
- License: gpl-3.0
- Created: 2018-07-16T11:28:08.000Z (almost 7 years ago)
- Default Branch: master
- Last Pushed: 2018-08-09T17:26:47.000Z (almost 7 years ago)
- Last Synced: 2025-01-19T11:24:36.684Z (6 months ago)
- Topics: jupyter-notebook, sciviews, vtk, vtk-applications
- Language: Jupyter Notebook
- Homepage:
- Size: 106 KB
- Stars: 0
- Watchers: 3
- Forks: 0
- Open Issues: 0
-
Metadata Files:
- Readme: README.md
- License: LICENSE
Awesome Lists containing this project
README
# VTK-Geopotential-data
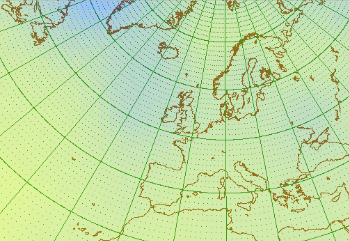
The idea is to represent geopotential data from a concrete instant of time and draw it over the cartography to visualize the necessary property values by using OpenGL or the VTK library.
In order to perform this kind of visualizations with the provided geopotential data two techniques were proposed: transfer function , and the isocontours construction.
In order to run SciVis_FranRodrigo.ipynb, open it with Jupyter notebooks and click on "restart kernel, and then re-run the whole notebook", or run every notebook's cell in order.
Interaction keyshorts:
- The 'q' key exists the render, and restart the Python kernel.
- The 'a' key adds/removes the parallels/meridians/points from the render.
- The 's' key in the transfer function mode, changes the range of colours.
- The 'z' and 'x' keys change the GeoPotential file.
- The 'n' and 'm' keys change the number of divisions in IsoContour mode.
- The 'c' key switches between IsoContour mode and Mixed Visualization mode.
#### License
Copyright 2018 Francisco Javier Rodrigo Ginés
This program is free software: you can redistribute it and/or modify
it under the terms of the GNU General Public License as published by
the Free Software Foundation, either version 3 of the License, or
(at your option) any later version.
This program is distributed in the hope that it will be useful,
but WITHOUT ANY WARRANTY; without even the implied warranty of
MERCHANTABILITY or FITNESS FOR A PARTICULAR PURPOSE. See the
GNU General Public License for more details.
You should have received a copy of the GNU General Public License
along with this program. If not, see .