https://github.com/fvd/conceptr
R Tools for Concept Hierarchies
https://github.com/fvd/conceptr
Last synced: 10 months ago
JSON representation
R Tools for Concept Hierarchies
- Host: GitHub
- URL: https://github.com/fvd/conceptr
- Owner: FvD
- License: other
- Created: 2015-09-24T20:35:11.000Z (almost 11 years ago)
- Default Branch: master
- Last Pushed: 2016-03-14T16:10:06.000Z (over 10 years ago)
- Last Synced: 2025-04-14T13:53:01.837Z (over 1 year ago)
- Language: R
- Homepage:
- Size: 126 KB
- Stars: 0
- Watchers: 0
- Forks: 0
- Open Issues: 0
-
Metadata Files:
- Readme: README.md
Awesome Lists containing this project
README
[](https://travis-ci.org/FvD/conceptr)
[](https://codecov.io/github/FvD/conceptr?branch=master)
***
Please look into
[data.tree](https://cran.r-project.org/web/packages/data.tree/index.html)
package first if you need a way to work with hierarchical data structured as
trees. The `data.tree` package is mature and probably does what you need.
This is a convenience package that includes amongst other things the posibility
to read trees in self-referencing tables. There is no release yet, and is under
active development. Be careful if you use the current development version as
you may likely run into be errors.
***
# conceptr
Concept hierarchies are common in many knowledge areas and applications of
statistics. They can be deceptively simple, as they are easy to intuit, but can
offer annoying problems while working with them as data set.
This package was made with a specific concept hierarchy in mind where the
hierarchy is represented by a table with id, concept-name and parent-id. This
structure that is often found in biological data, in competency data (Human
Resource Management) and business-inventories.
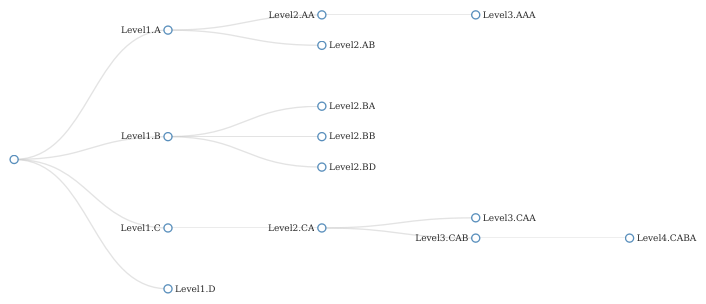
A typical example could be as follows:
Level1: A B C D
| | |
Level2: AA AB BA BB BD CA
| |
Level3: AAA CAA CAB
|
Level4: CABA
This kind of tree structure can be used for instance on hierarchies such as
tree > Oak > White Oak. Or Technical Skills > Programming > R, or Sales > EMEA >
Europe > Lithuania. These are also called multilevel classes, or multilevel
features (in Machine Learning applications).
The goal of the package `conceptr` package is to help you when you need to work
with these kinds of data by allowing you to make the hierarchy corresponding to
the data explicit so that it becomes easier to:
1. Roll-up data into higher order concepts, even if they are implied but not
included in the data set itself. For example, you have White Oaks and
Chihuaha Oaks, but no entry for "Oaks". That higher order concept "Oak" is
implicit in the data set and can be added by summing sub-level concept.
2. Visualize the hierarchies as a tree using networkD3.
3. Inspect the data to see whether it conforms with the given hierarchy
4. Visualize data in the hierarchy using ternary diagrams.
## Installation
The package is still far from complete, so please be mindful of errors if you
are going to use this. By all means report or fix any issues that you may find.
To install makes sure you have the package `devtools` installed and run:
devtools::install_github("fvd/conceptr")
## Usage
### Data formats
The library is still primitive and not tested for all possible exceptions. You
can help by reporting any issues you find with your data so that the package
can be made more generic.
At the moment a number of conventions are imposed:
1. The `hierarchy` data frame has three columns with names `c("id","name",
"parent_id")`
1. The column names in the `data` data frame need to match the names in
`hierarachy$name`
Note that to match the names in the hierarchy and data data frames both the
`hierarchy$name` column and column names in `data` will be normalized with
`make.names`.
## Features
### Aggregate data
Aggregate all data from all the sub-levels of a concept by summing the
observations. So in the example `aggregate_byname(D)` returns `D` and
`aggregate_byname(B)` returns `B+BA+BB+BD`. We need to reference the hierarchy
to use so the full example would be:
aggregate_byname(data, hierarchy, "Level1-D")
and
aggregate_byname(data, hierarchy, "Level1-B")
The full names in the test data base include the levels, so Level1-A, Level2-AA
etc.
### Visualize hierarchies
### Plot selected concepts
Make exploratory analysis of the data at different levels easier by plotting by
name.
visualize_ternary(data, hierarchy, c("A", "BA", "CAA"))
### Planned
* Visualize hierarchy (create tree with networkD3)
* Inspect hierarchy (check the structure of the hierarchy)
## Example data
There is a small example data set included that you can compare to your own.
Please note that you preferably use R-style names (no spaces, no non-ASCII) for
the column names in the data file. The package will `make.normal` any names
that it will find.
To load the test data from the inst folder in the package:
data <- read.csv(system.file("data.csv", package="conceptr"))
hierarchy <- read.csv(system.file("concept-hierarchy.csv", package="conceptr"))