https://github.com/g-gundam/technicalindicatorcharts.jl
Visualize OnlineTechnicalIndicators.jl using LightweightCharts.jl.
https://github.com/g-gundam/technicalindicatorcharts.jl
julia technical-analysis visualization
Last synced: over 1 year ago
JSON representation
Visualize OnlineTechnicalIndicators.jl using LightweightCharts.jl.
- Host: GitHub
- URL: https://github.com/g-gundam/technicalindicatorcharts.jl
- Owner: g-gundam
- License: mit
- Created: 2024-07-14T16:38:27.000Z (almost 2 years ago)
- Default Branch: main
- Last Pushed: 2025-02-05T23:38:40.000Z (over 1 year ago)
- Last Synced: 2025-02-06T00:27:30.536Z (over 1 year ago)
- Topics: julia, technical-analysis, visualization
- Language: Julia
- Homepage: https://g-gundam.github.io/TechnicalIndicatorCharts.jl/dev/
- Size: 896 KB
- Stars: 2
- Watchers: 2
- Forks: 1
- Open Issues: 0
-
Metadata Files:
- Readme: README.md
- License: LICENSE
Awesome Lists containing this project
README
# TechnicalIndicatorCharts
[](https://g-gundam.github.io/TechnicalIndicatorCharts.jl/dev/)
[](https://github.com/g-gundam/TechnicalIndicatorCharts.jl/actions/workflows/CI.yml?query=branch%3Amain)
[](https://codecov.io/gh/g-gundam/TechnicalIndicatorCharts.jl)
Visualize
[OnlineTechnicalIndicators.jl](https://github.com/femtotrader/OnlineTechnicalIndicators.jl) using
[LightweightCharts.jl](https://github.com/bhftbootcamp/LightweightCharts.jl).
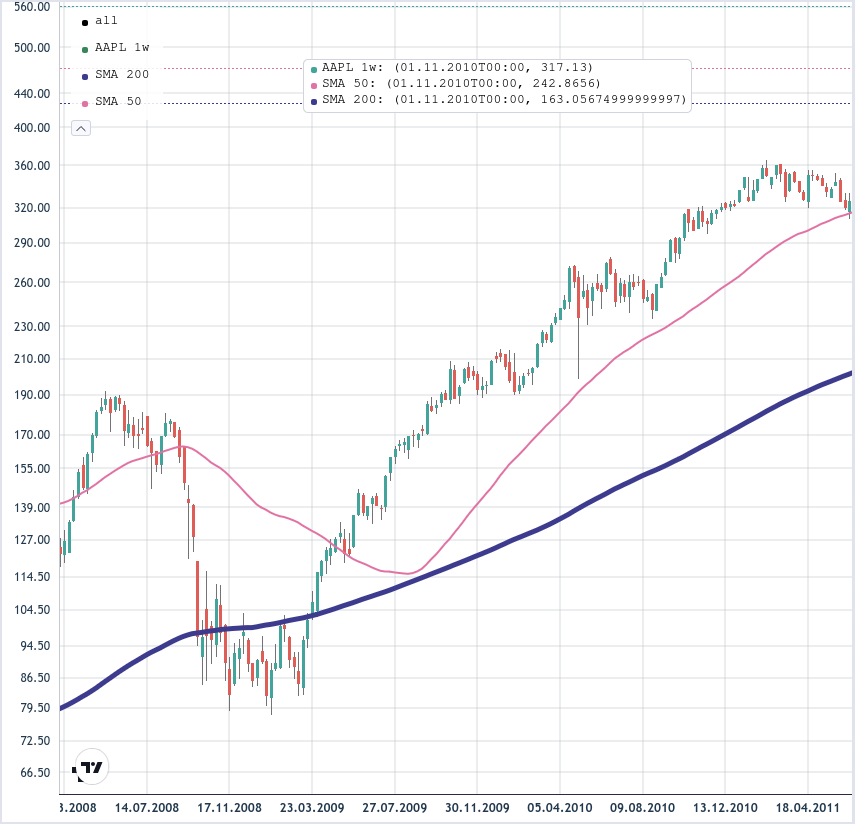
## Creating a Chart
```julia
using OnlineTechnicalIndicators
using TechnicalIndicatorCharts
golden_cross_chart = Chart(
"AAPL", Week(1);
indicators = [
SMA{Float64}(;period=50), # Setup indicators
SMA{Float64}(;period=200)
],
visuals = [
Dict(
:label_name => "SMA 50", # Describe how to draw indicators
:line_color => "#E072A4",
:line_width => 2
),
Dict(
:label_name => "SMA 200",
:line_color => "#3D3B8E",
:line_width => 5
)
]
)
```
## Feeding Your Chart Data
Adding new data to the chart is done with the `update!(chart, candle)` function.
```julia
using MarketData
for row in eachrow(AAPL)
c = Candle(
ts=DateTime(row.timestamp),
o=row.Open,
h=row.High,
l=row.Low,
c=row.Close,
v=row.Volume
)
update!(golden_cross_chart, c)
end
```
Notice that `update!` took daily candles from `AAPL` and aggregated them into weekly candles.
> The `update!` function was designed to consume low timeframe candles to incrementally build higher timeframe charts. Imagine unfinished 1m candles from a websocket being consumed to generate multiple higher-timeframe charts for the same market. The hope was that this would facilitate realtime, multi-timeframe analysis.
## Visualization
The `visualize` function will take a chart and generate something that `lwc_show` from [LightweightCharts.jl](https://github.com/bhftbootcamp/LightweightCharts.jl) can display.
```julia
using LightweightCharts
lwc_show(visualize(golden_cross_chart))
# Or
golden_cross_chart |> visualize |> lwc_show
```
## Supported Indicators
- [ ] AccuDist
- [ ] ADX
- [x] [ALMA](https://www.tradingview.com/support/solutions/43000594683-arnaud-legoux-moving-average/)
- [ ] AO
- [ ] Aroon
- [x] [ATR](https://www.tradingview.com/support/solutions/43000501823-average-true-range-atr/)
- [x] [BB](https://www.tradingview.com/support/solutions/43000501840-bollinger-bands-bb/)
- [ ] BOP
- [ ] CCI
- [ ] ChaikinOsc
- [ ] ChandeKrollStop
- [ ] CHOP
- [ ] CoppockCurve
- [x] [DEMA](https://www.tradingview.com/support/solutions/43000589132-double-exponential-moving-average-ema/)
- [ ] DonchianChannels
- [ ] DPO
- [x] [EMA](https://www.tradingview.com/support/solutions/43000592270-exponential-moving-average/)
- [ ] EMV
- [ ] ForceIndex
- [x] [HMA](https://www.tradingview.com/support/solutions/43000589149-hull-moving-average/)
- [ ] KAMA
- [x] [KeltnerChannels](https://www.tradingview.com/support/solutions/43000502266-keltner-channels-kc/)
- [ ] KST
- [ ] KVO
- [ ] MACD
- [ ] MassIndex
- [x] [McGinleyDynamic](https://www.tradingview.com/support/solutions/43000589175-mcginley-dynamic/)
- [ ] MeanDev
- [x] [OBV](https://www.tradingview.com/support/solutions/43000502593-on-balance-volume-obv/)
- [ ] ParabolicSAR
- [ ] PivotsHL
- [ ] ROC
- [x] [RSI](https://www.tradingview.com/support/solutions/43000502338-relative-strength-index-rsi/)
- [ ] SFX
- [x] [SMA](https://www.tradingview.com/support/solutions/43000696841-simple-moving-average/)
- [x] [SMMA](https://www.tradingview.com/support/solutions/43000591343-smoothed-moving-average/)
- [ ] SOBV
- [ ] STC
- [ ] StdDev
- [ ] Stoch
- [x] [StochRSI](https://www.tradingview.com/support/solutions/43000502333-stochastic-rsi-stoch-rsi/)
- [ ] SuperTrend
- [ ] T3
- [ ] TEMA
- [ ] TRIX
- [ ] TrueRange
- [x] [TSI](https://www.tradingview.com/support/solutions/43000592290-true-strength-index/)
- [ ] TTM
- [ ] UO
- [ ] VTX
- [ ] VWAP
- [ ] VWMA
- [x] [WMA](https://www.tradingview.com/support/solutions/43000594680-weighted-moving-average/)
- [ ] ZLEMA
See Also: [Indicators support - OnlineTechnicalIndicators.jl](https://femtotrader.github.io/OnlineTechnicalIndicators.jl/dev/indicators_support/)
Help Wanted: [Visualization Function Writers](https://g-gundam.github.io/TechnicalIndicatorCharts.jl/dev/indicators/)