Ecosyste.ms: Awesome
An open API service indexing awesome lists of open source software.
https://github.com/gabriel-pinheiro/ping-exporter
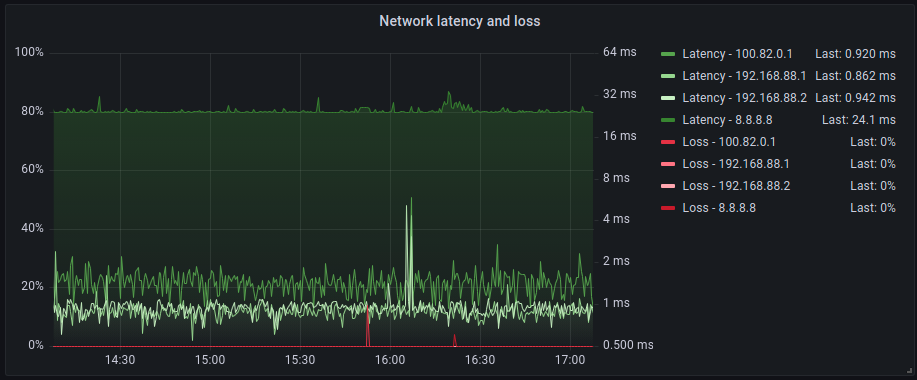
Export ping (ICMP) latency and loss data to Prometheus
https://github.com/gabriel-pinheiro/ping-exporter
home icmp monitoring network ping prometheus prometheus-exporter
Last synced: about 1 month ago
JSON representation
Export ping (ICMP) latency and loss data to Prometheus
- Host: GitHub
- URL: https://github.com/gabriel-pinheiro/ping-exporter
- Owner: gabriel-pinheiro
- License: apache-2.0
- Created: 2021-08-11T16:23:26.000Z (over 3 years ago)
- Default Branch: main
- Last Pushed: 2021-08-22T20:17:21.000Z (over 3 years ago)
- Last Synced: 2024-10-06T04:43:05.111Z (4 months ago)
- Topics: home, icmp, monitoring, network, ping, prometheus, prometheus-exporter
- Language: TypeScript
- Homepage:
- Size: 84 KB
- Stars: 2
- Watchers: 1
- Forks: 0
- Open Issues: 1
-
Metadata Files:
- Readme: README.md
- License: LICENSE
Awesome Lists containing this project
README
# Ping Exporter
Export ping (ICMP) latency and loss data to Prometheus

## Getting started
Run it with docker:
```shell
$ docker run -d \
-p 9862:9862 \
-e 'PING_HOSTS=["1.1.1.1","8.8.8.8"]' \
gabrielctpinheiro/ping-exporter
$ curl http://localhost:9862/metrics
```
Run it with docker-compose:
```shell
$ git clone https://github.com/gabriel-pinheiro/ping-exporter.git
$ cd ping-exporter
$ docker-compose up -d
$ curl http://localhost:9862/metrics
```
Run it with npm (Linux only):
```shell
$ git clone https://github.com/gabriel-pinheiro/ping-exporter.git
$ cd ping-exporter
$ npm install
$ npm run start:dev
$ curl http://localhost:9862/metrics
```
## Settings
You can set the following environment variables to customize ping-exporter:
```shell
# Interface to bind the server
SERVER_HOST=0.0.0.0
# Port to listen
SERVER_PORT=9862
# Name to add to labels (used to differenciate when there are multiple instances pinging the same host)
SERVER_NAME=node01
# Hosts to monitor
PING_HOSTS=["1.1.1.1", "8.8.8.8"]
# Amount of ICMP packets to send when no loss is detected
PING_SHORT-COUNT=5
# Amount of ICMP packets to send when partial loss is detected
PING_LONG-COUNT=15
# Seconds to wait between probing the hosts (recommended: 1.5 * (PING_SHORT-COUNT + PING_LONG-COUNT) - 1)
PING_INTERVAL=29
```
## Prometheus Integration
Add this item to the the `scrape_configs` of your `prometheus.yml`:
```yaml
scrape_configs:
- job_name: ping_exporter
scrape_interval: 30s
static_configs:
- targets: ['PING_EXPORTER_HOST:9862']
```
Where `PING_EXPORTER_HOST` is the hostname in which ping-exporter is running.
## Exported Metrics
### `ping_latency_min`, `ping_latency_avg`, `ping_latency_max`
- **Type:** gauge
- **Labels:** `host`, `name`
RTT (round time trip) min, average and max latency.
Sample queries:
```promql
ping_latency_avg
```
```promql
ping_latency_avg{host="1.1.1.1"}
```
```promql
ping_latency_avg{name="node01"}
```
### `ping_loss`
- **Type:** gauge
- **Labels:** `host`, `name`
Packet loss percentage
Sample queries:
```promql
ping_loss
```
```promql
ping_loss{host="1.1.1.1"}
```
```promql
ping_loss{name="node01"}
```