Ecosyste.ms: Awesome
An open API service indexing awesome lists of open source software.
https://github.com/gedankenstuecke/scihub_analysis
Analyzing the April 2016 Data about the Usage of Sci-Hub
https://github.com/gedankenstuecke/scihub_analysis
Last synced: 2 months ago
JSON representation
Analyzing the April 2016 Data about the Usage of Sci-Hub
- Host: GitHub
- URL: https://github.com/gedankenstuecke/scihub_analysis
- Owner: gedankenstuecke
- License: mit
- Created: 2016-04-30T22:40:49.000Z (over 8 years ago)
- Default Branch: master
- Last Pushed: 2016-05-24T21:10:20.000Z (over 8 years ago)
- Last Synced: 2024-10-29T21:57:26.263Z (3 months ago)
- Language: R
- Homepage: http://ruleofthirds.de/analyzing-scihub-data/
- Size: 29 MB
- Stars: 28
- Watchers: 4
- Forks: 2
- Open Issues: 3
-
Metadata Files:
- Readme: README.md
- License: LICENSE
Awesome Lists containing this project
README

# SciHub Data Analysis
These are some scripts to analyse the data sets published by SciHub. You can find some analysis and texts about insights already won from the data at [Science](http://www.sciencemag.org/news/2016/04/whos-downloading-pirated-papers-everyone) and the [DataDryad Blog](https://blog.datadryad.org/2016/04/28/sci-hub-stories/).
I wrote [a blogpost based on the analyses done with this code](http://ruleofthirds.de/analyzing-scihub-data/) which you might want to check out for some context. There's also a [follow up blogpost by me on how to integrate the information on whether access was made from universities or now](http://ruleofthirds.de/scihub-part2/).
## When are people downloading via SciHub?
Run `download_time_analysis.R` and pass one of the `*.tab` files, yields a `graphs/download_time.pdf`. Watch out: The time zones are not taken into account, everything's UTC. For that reason there are two filtered files in `graphs/`, one for Hong Kong (UTC+7) and one for Germany (UTC+1) as examples.
## Aggregate by country
Handling the complete files on my poor little notebook and in R was bit too much, so for looking at country-wise statistics I decided to calculate the aggregates the lazy bioinformatics-way:
`cut -f 4 *.tab|sort|uniq -c|sort -n|awk '{out=$1"\t"; for(i=2;i<=NF;i++){out=out" "$i}; print out}' > countrywise.csv`
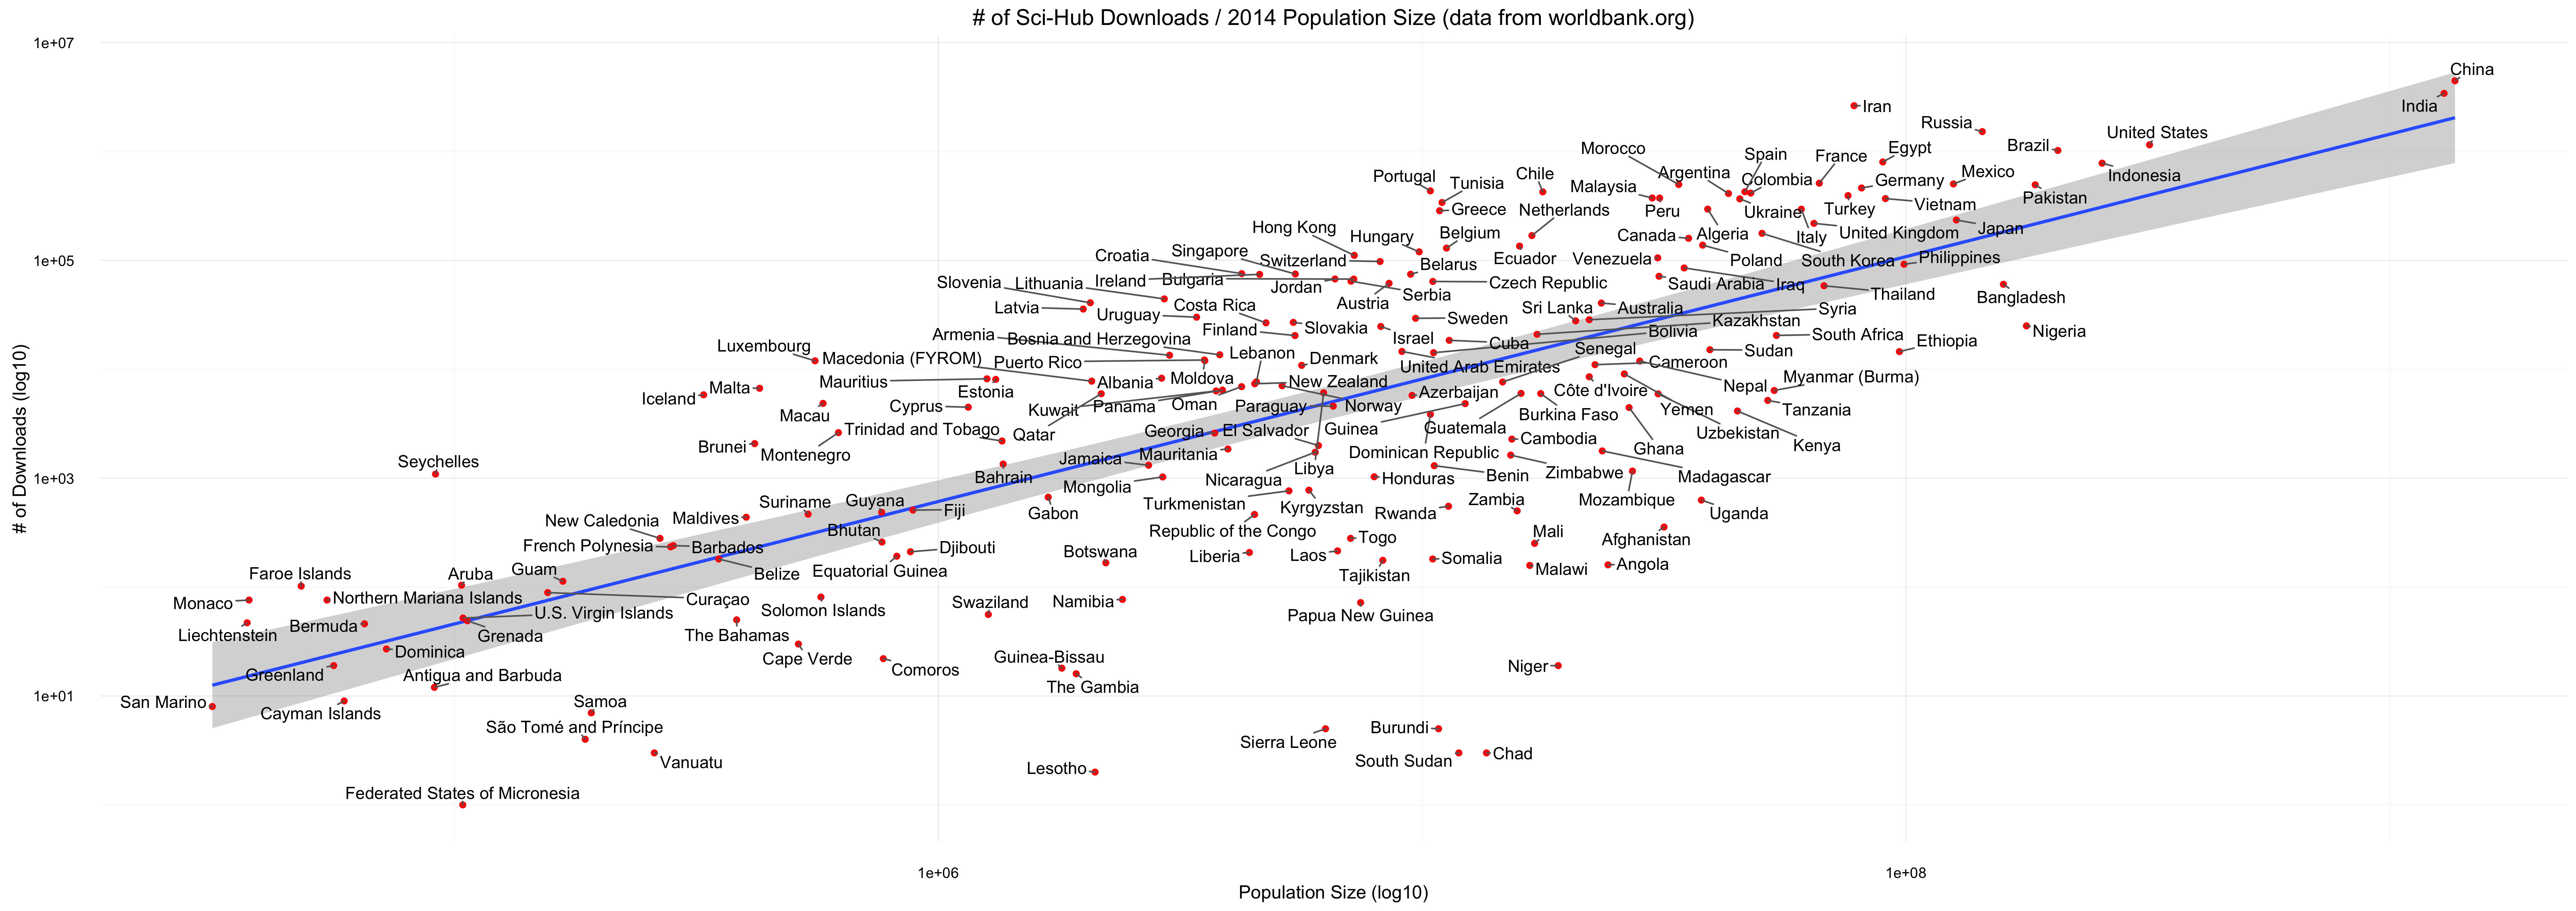
### Compare Downloads per Country to Population Size
The [World Bank offers the Population Sizes for 214 countries/economies as of 2014](http://data.worldbank.org/data-catalog/Population-ranking-table), amongst other file types as a csv. I used those and for now manually matched those to the countries listed in the *SciHub* data. Results are in `country_downloads_population.csv` (If no match could be made I just removed the country for now). The population numbers are in 1.000's.
This file is used by `population_analysis.R` to analyze how the population size and number of downloads are connected (`graphs/downloads_per_population.pdf`). Fitting a glm on the data the script also gives you the residuals, ranking which countries have how much more/less downloads than one would expect (`graphs/downloads_per_population_residuals.pdf`).
Last but not least the script also gives you the number of downloads per 1.000 inhabitants (`graphs/downloads_per_population_ranked.pdf`).
## Are people inside universities using Sci-Hub? And to which extend?
I was lucky enough to be put in touch with Sci-Hub and they used this list to classify their data on whether it comes from university IP ranges or not. For privacy reasons the data is more highly aggregated. [A blog post on these analyses can be found here](http://ruleofthirds.de/scihub-part2/).
The first data set (*uni-stats-date.tab*) contains the percentage of academic downloads for a given day.
```
2015-09-01 6.86
2015-09-02 7.14
2015-09-03 6.99
2015-09-04 6.62
2015-09-05 3.69
2015-09-06 3.58
2015-09-07 6.69
2015-09-08 6.93
```
The second one (*uni-stats-country.tab*) contains the percentage of academic downloads for each 10 days, split by country:
```
2015-09-0* Colombia 13.49
2015-09-0* United States 5.98
2015-09-0* China 5.65
2015-09-0* Chile 11.88
2015-09-0* Portugal 0.01
2015-09-0* Morocco 0
2015-09-0* Croatia 0
2015-09-0* Egypt 8.2
```
## Dependencies
The R scripts use *ggplot2*, *ggrepel*, *ggthemes* and *lubridate*.
## Questions
### Where's the raw data?
It's available at DataDryad, so it's not included here. [Download it from there](http://dx.doi.org/10.5061/dryad.q447c).
### What are the timezones?
The times in the data set are all in UTC+3 (it said UTC earlier, but I was corrected on that), so you'll have to adjust them for the corresponding time zones if interested in analyzing those. Or you could just ignore it for now as I did above, because I'm lazy.
### What are the licenses?
The Sci-Hub data is [CC-Zero, as indicated on DataDryad](http://datadryad.org/resource/doi:10.5061/dryad.q447c). The [World Bank uses their own ToS for the data](http://web.worldbank.org/WBSITE/EXTERNAL/0,,contentMDK:22547097~pagePK:50016803~piPK:50016805~theSitePK:13,00.html). My uglyish code is under MIT license, please take it.
### Can I Contribute?
Most definitely, I'm happy for everyone who likes to join me or has suggestions in what to analyze next! Get in touch through the issues or via [Twitter](http://www.twitter.com/gedankenstuecke).