https://github.com/george0st/qgate-graph
The graph visualization under quality gate solution
https://github.com/george0st/qgate-graph
graphs python quality-gate
Last synced: over 1 year ago
JSON representation
The graph visualization under quality gate solution
- Host: GitHub
- URL: https://github.com/george0st/qgate-graph
- Owner: george0st
- License: apache-2.0
- Created: 2023-04-27T20:20:36.000Z (about 3 years ago)
- Default Branch: main
- Last Pushed: 2024-12-04T11:28:58.000Z (over 1 year ago)
- Last Synced: 2025-03-28T16:04:29.330Z (over 1 year ago)
- Topics: graphs, python, quality-gate
- Language: Python
- Homepage:
- Size: 3.09 MB
- Stars: 118
- Watchers: 1
- Forks: 0
- Open Issues: 0
-
Metadata Files:
- Readme: README.md
- License: LICENSE
Awesome Lists containing this project
README
[](https://opensource.org/licenses/Apache-2.0)
[](https://pypi.python.org/pypi/qgate-graph/)


# QGate-Graph
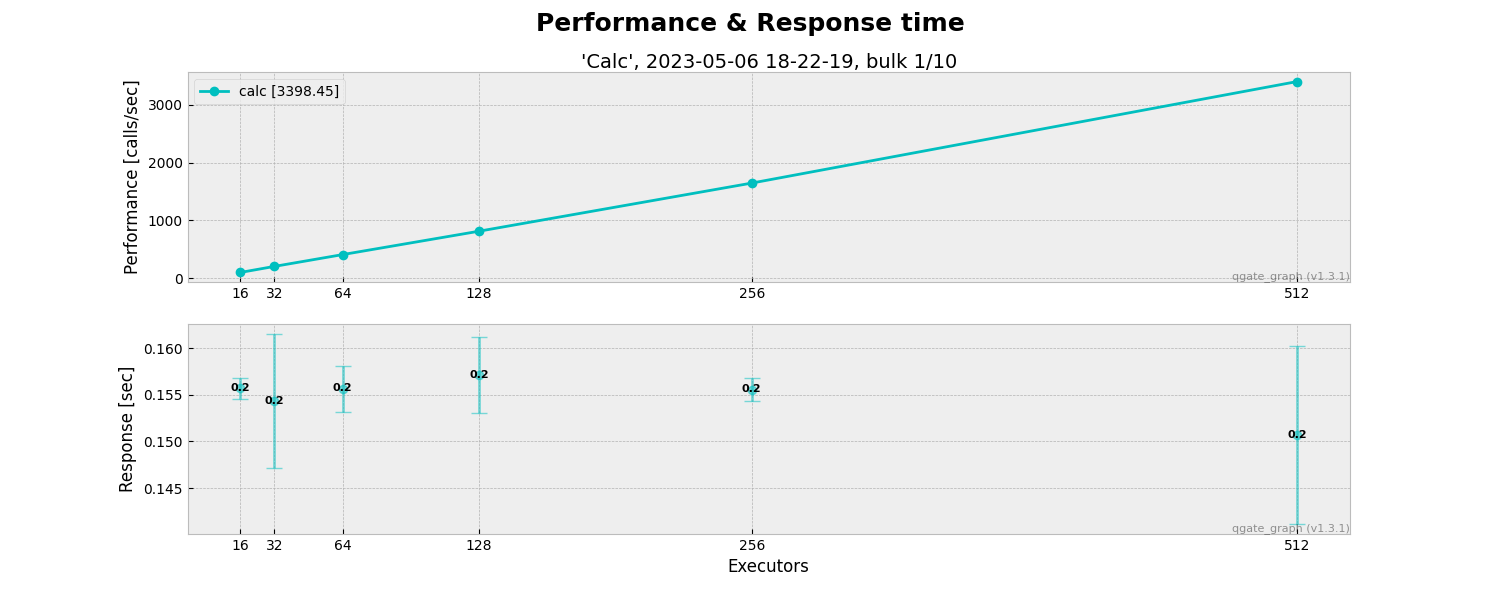
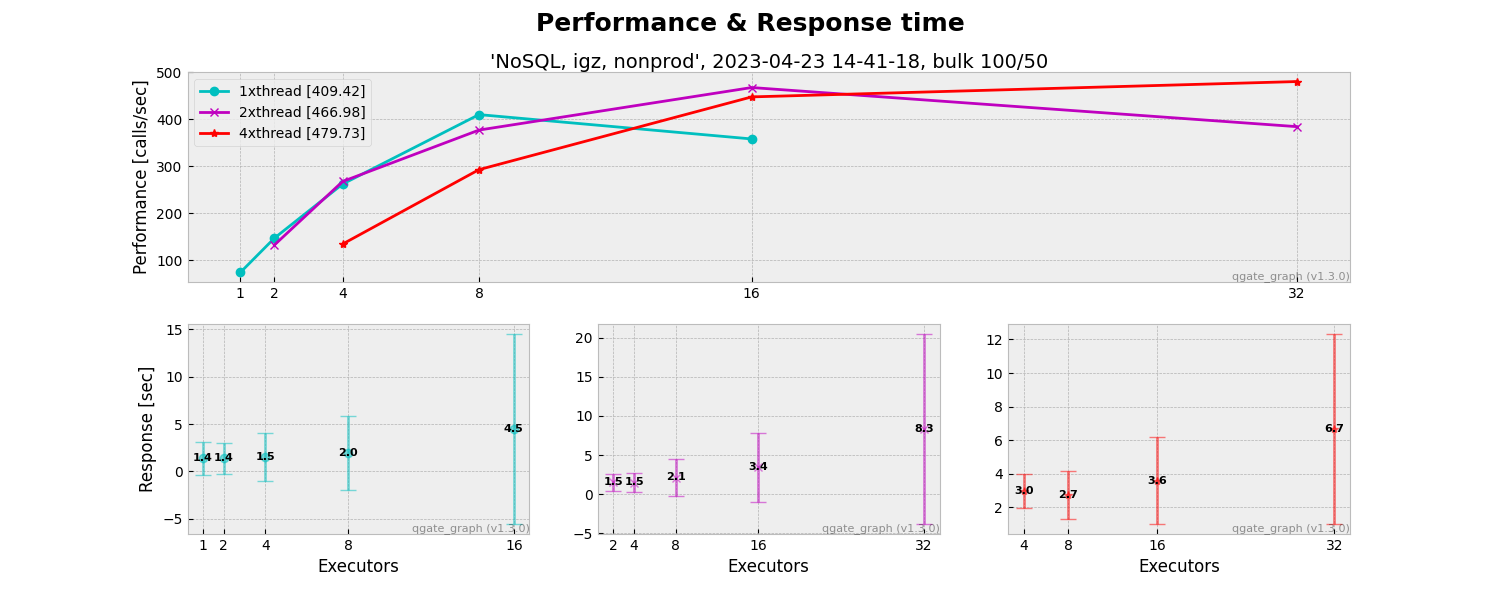
The QGate graph generates graphical outputs based on performance tests (QGate Perf). Key benefits:
- provide graphs about Performance/Throughput and Response time (on typically client side)
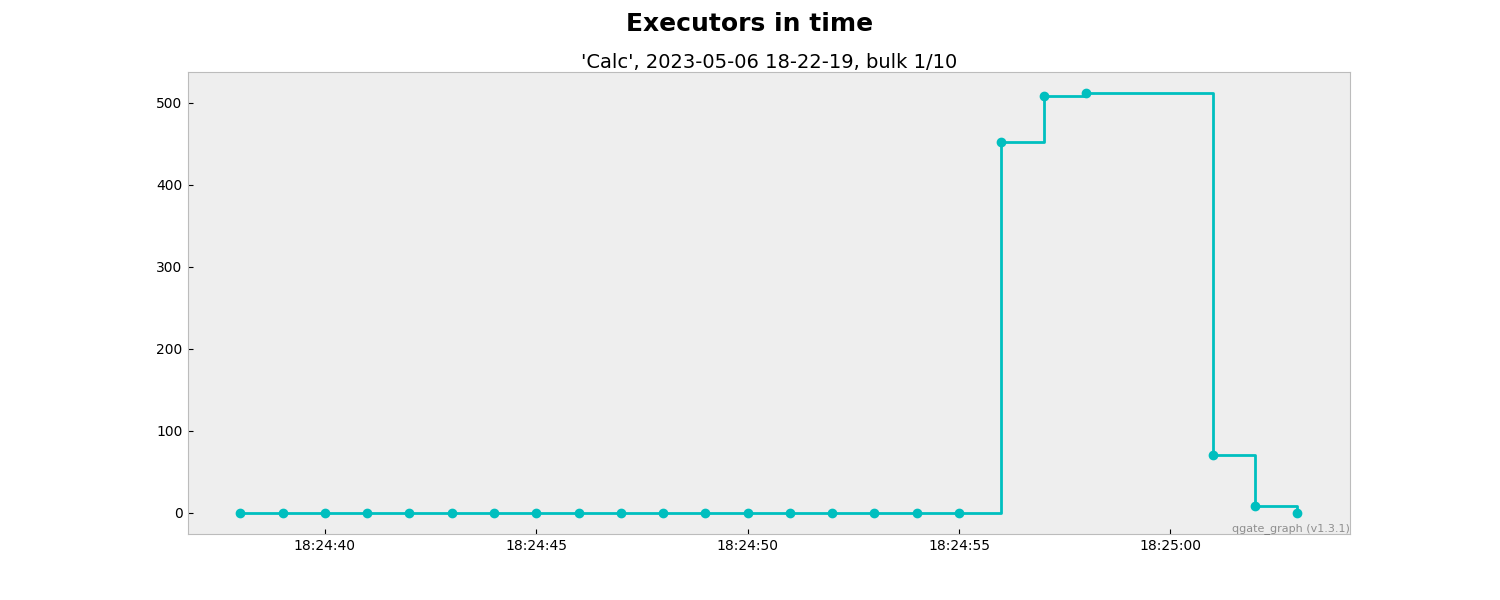
- provide graphs about Executors in time
It is a quick way, how you can identify real performance for your python solution.
NOTE: These graphs only visualize outputs from performance tests (QGate Perf), it is not replacement of
detail views from Grafana, Prometheus, etc. in detail of CPU, GPU, RAM, I/O etc. on
side of testing system.
## Usage
```python
from qgate_graph.graph_performance_txt import GraphPerformanceTxt
from qgate_graph.graph_performance_csv import GraphPerformanceCsv
from qgate_graph.graph_performance import GraphPerformance
from qgate_graph.graph_executor import GraphExecutor
import logging
# setup login level
logging.basicConfig()
logging.getLogger().setLevel(logging.INFO)
# generate performance/throughput graphs
graph=GraphPerformance()
graph.generate_from_dir()
# generate executors in time graphs
graph=GraphExecutor()
graph.generate_from_dir()
# generate performance/throughput graphs in TXT form
graph=GraphPerformanceTxt()
graph.generate_from_dir()
# generate performance/throughput graphs in CSV form
graph=GraphPerformanceCsv()
graph.generate_from_dir()
```
## Sample of outputs
#### Performance/Throughput & Response time
#### Executors in time

#### Performance/Throughput & Response time in [TXT form](https://github.com/george0st/qgate-graph/blob/main/assets/TXT-cassandra-163551-W1-low-RAW-2024-10-11_14-36-07-bulk-200x10.txt?raw=true)

#### Performance/Throughput & Response time in [CSV form](https://github.com/george0st/qgate-graph/blob/main/assets/CSV-cassandra-235115-W2-med-RAW-2024-10-11_22-14-47-bulk-200x20.csv?raw=true)
