https://github.com/ghilesmeddour/aecg
Python parser and viewer for Annotated ECG HL7 files.
https://github.com/ghilesmeddour/aecg
ecg ecg-data ecg-signal electrocardiogram health-data hl7 hl7-parser
Last synced: 4 months ago
JSON representation
Python parser and viewer for Annotated ECG HL7 files.
- Host: GitHub
- URL: https://github.com/ghilesmeddour/aecg
- Owner: ghilesmeddour
- Created: 2024-10-23T09:00:04.000Z (over 1 year ago)
- Default Branch: main
- Last Pushed: 2026-02-05T12:50:33.000Z (4 months ago)
- Last Synced: 2026-02-05T23:54:52.180Z (4 months ago)
- Topics: ecg, ecg-data, ecg-signal, electrocardiogram, health-data, hl7, hl7-parser
- Language: Python
- Homepage: https://annotated-ecg.streamlit.app
- Size: 2.09 MB
- Stars: 7
- Watchers: 1
- Forks: 2
- Open Issues: 0
-
Metadata Files:
- Readme: README.md
- Changelog: CHANGELOG.md
Awesome Lists containing this project
README
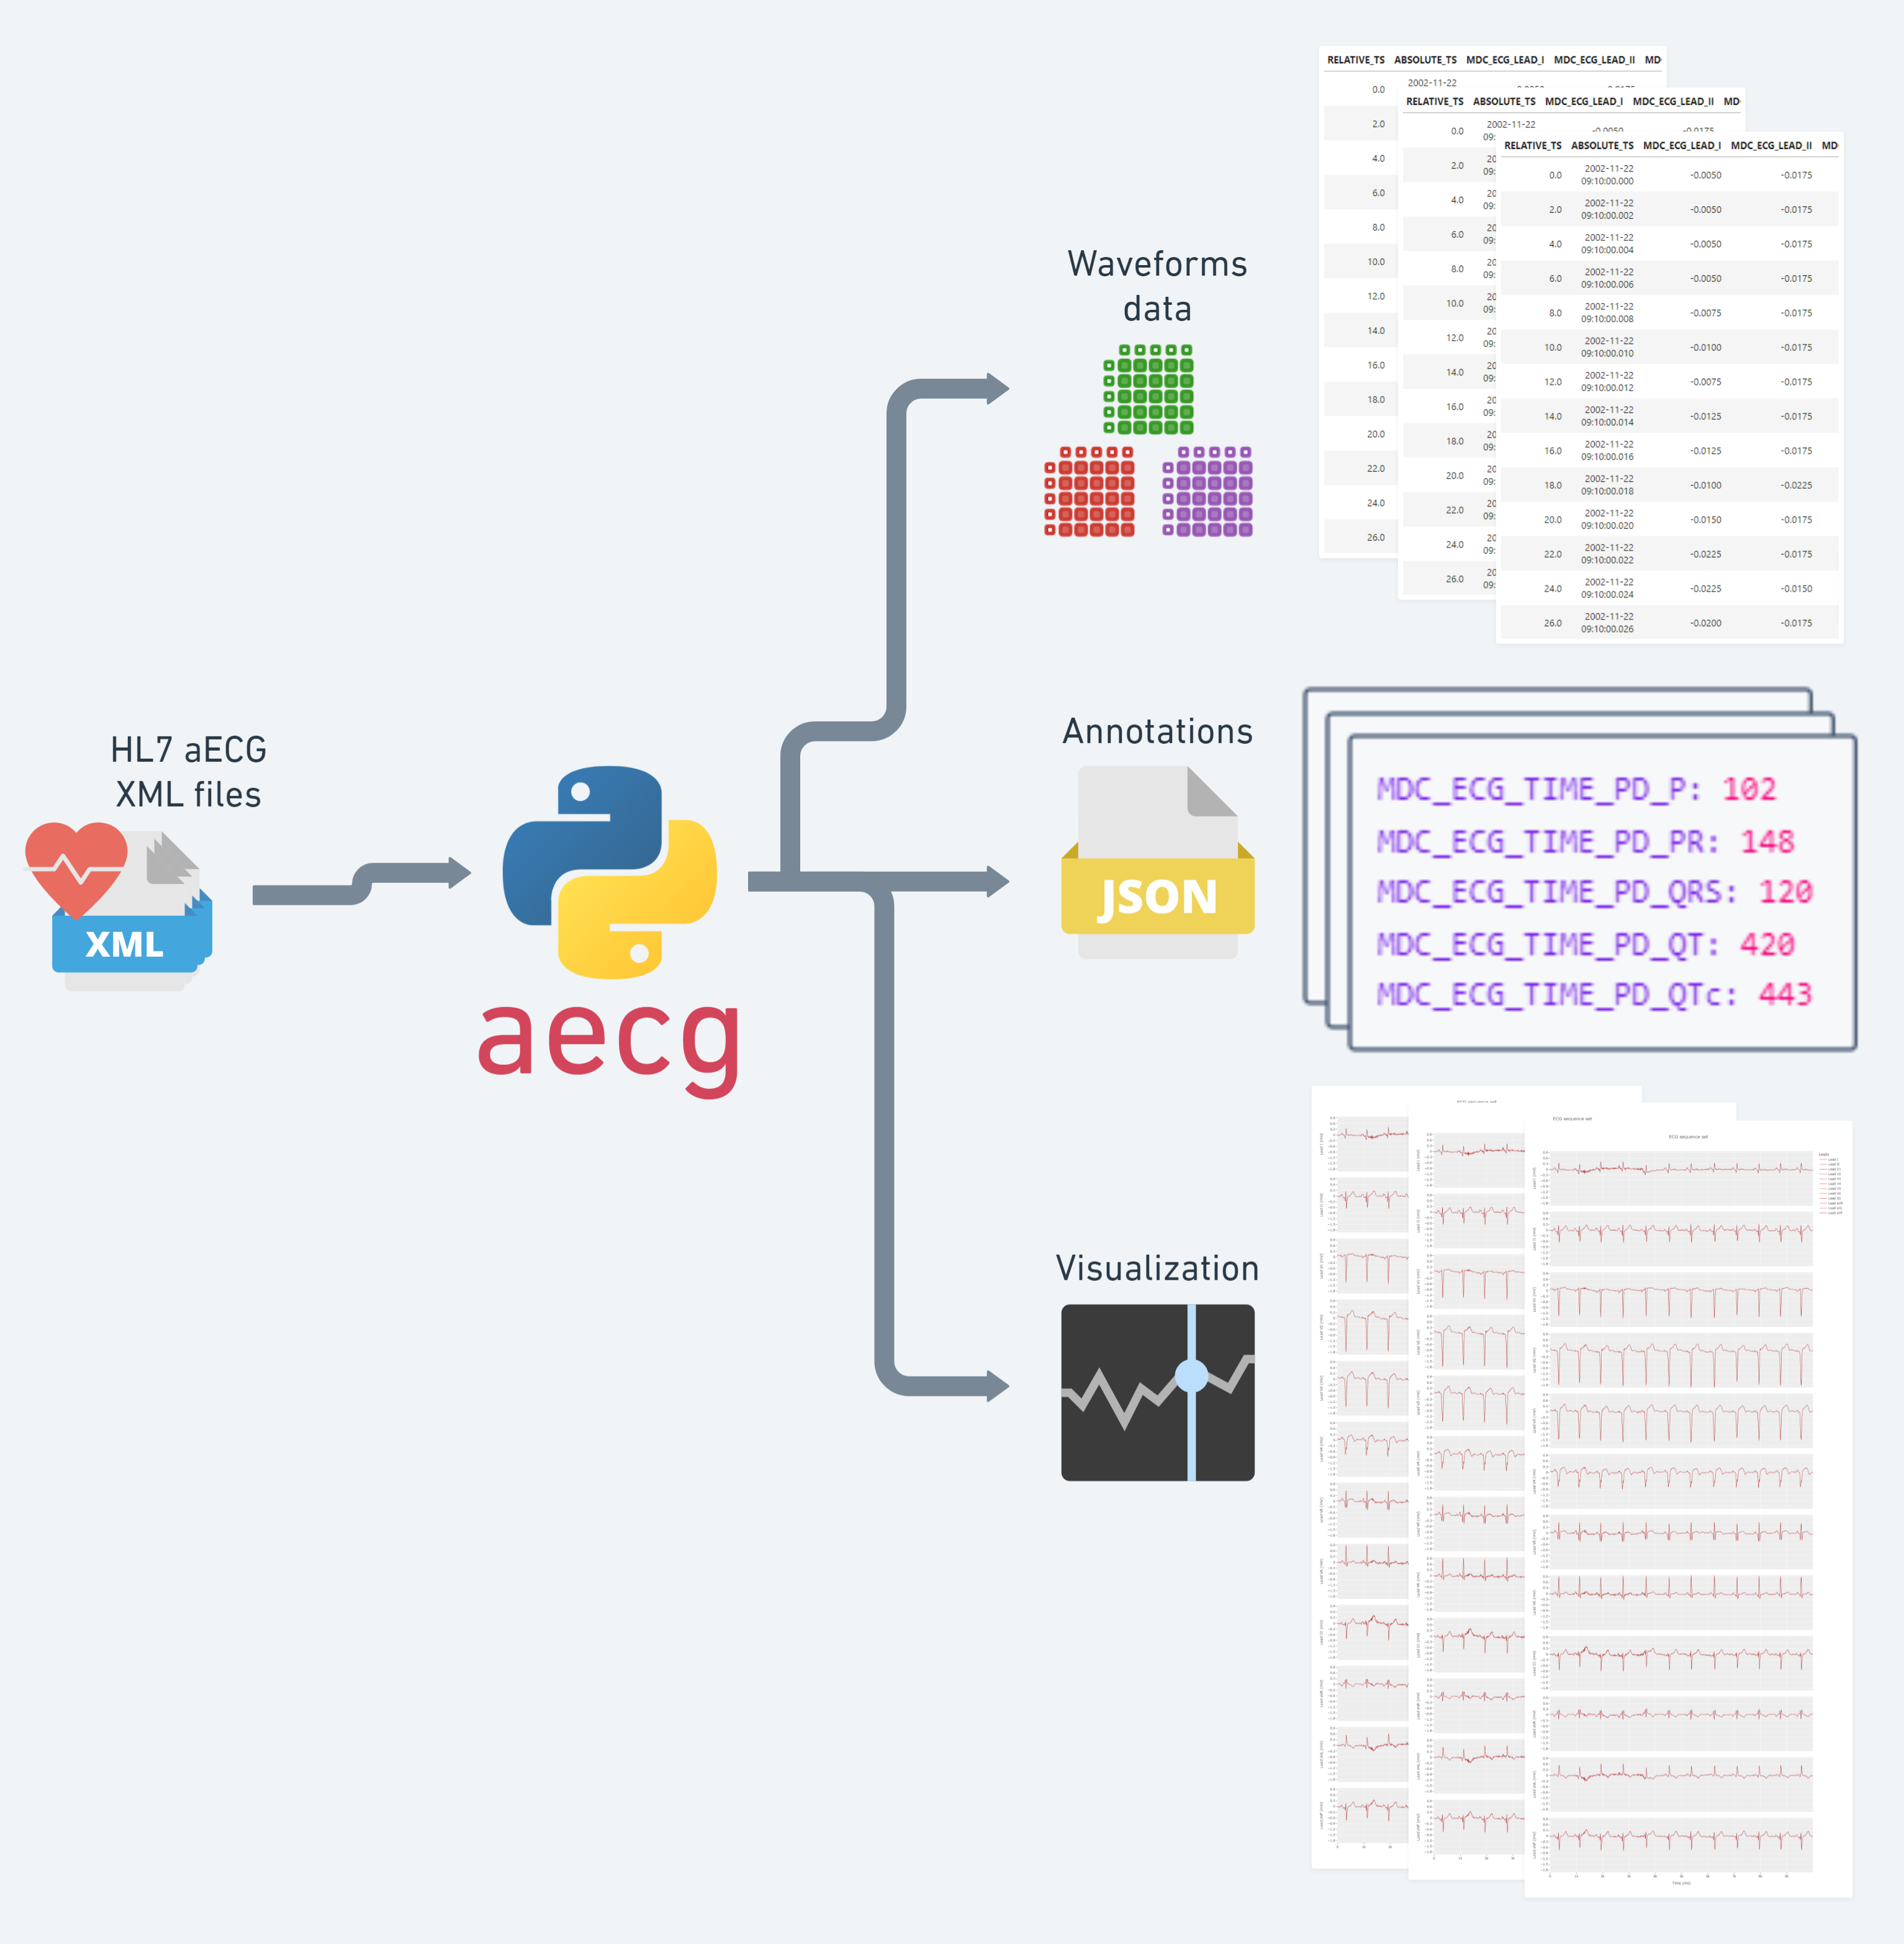
# aECG (Python parser for annotated ECG HL7 files)
Python library to parse and visualize [aECG files](https://en.wikipedia.org/wiki/HL7_aECG).
## Demo
[](https://annotated-ecg.streamlit.app/)
## Installation
```
pip install aecg
```
## Usage
- Read your aECG xml file.
```python
import aecg
file_path = r"tests/data/Example aECG.xml"
aecg_o = aecg.read(file_path)
```
- Use `summary` to get an overview of the data.
```python
aecg_o.summary()
```
```python
{
'id': UUID('61d1a24f-b47e-41aa-ae95-f8ac302f4eeb'),
'date': datetime.datetime(2002, 11, 22, 9, 10),
'series_count': 1,
'annotations_count': 167,
}
```
- Get waveforms dataframes and their associated plots.
```python
titles = []
dfs = []
figs = []
for serie in aecg_o.series:
for i, seq_set in enumerate(serie.sequence_sets, 1):
title = f"Serie {serie.id} | Sequence set {i}"
df = seq_set.get_sequences_df()
fig = aecg.plotter.plot_seq_set(df, title=title)
dfs.append(df)
titles.append(title)
figs.append(fig)
for i, seq_set in enumerate(serie.derived_sequence_sets, 1):
title = f"Serie {serie.id} | Derived sequence set {i}"
df = seq_set.get_sequences_df()
fig = aecg.plotter.plot_seq_set(df, title=title)
dfs.append(df)
titles.append(title)
figs.append(fig)
```
```python
dfs[0]
```

```python
figs[0].show()
```

- You can choose to plot all the curves together.
```python
aecg.plotter.plot_seq_set(dfs[0], plot_mode="one")
```
