https://github.com/giterlizzi/perl-chart-echarts
Apache ECharts from Perl
https://github.com/giterlizzi/perl-chart-echarts
apache-echarts chart echarts perl perl5
Last synced: about 1 year ago
JSON representation
Apache ECharts from Perl
- Host: GitHub
- URL: https://github.com/giterlizzi/perl-chart-echarts
- Owner: giterlizzi
- License: artistic-2.0
- Created: 2024-10-29T22:42:20.000Z (over 1 year ago)
- Default Branch: main
- Last Pushed: 2024-12-13T21:19:07.000Z (over 1 year ago)
- Last Synced: 2025-03-28T07:35:19.884Z (over 1 year ago)
- Topics: apache-echarts, chart, echarts, perl, perl5
- Language: Perl
- Homepage: https://metacpan.org/pod/Chart::ECharts
- Size: 34.2 KB
- Stars: 0
- Watchers: 1
- Forks: 0
- Open Issues: 1
-
Metadata Files:
- Readme: README.md
- Changelog: Changes
- License: LICENSE
Awesome Lists containing this project
README
[](https://github.com/giterlizzi/perl-Chart-ECharts/releases) [](https://github.com/giterlizzi/perl-Chart-ECharts/actions) [](https://github.com/giterlizzi/perl-Chart-ECharts) [](https://github.com/giterlizzi/perl-Chart-ECharts) [](https://github.com/giterlizzi/perl-Chart-ECharts) [](https://github.com/giterlizzi/perl-Chart-ECharts/issues) [](https://coveralls.io/github/giterlizzi/perl-Chart-ECharts)
# Chart::ECharts - Apache ECharts for Perl
## Synopsis
```.pl
use Chart::ECharts;
my $chart = Chart::ECharts->new( responsive => 1 );
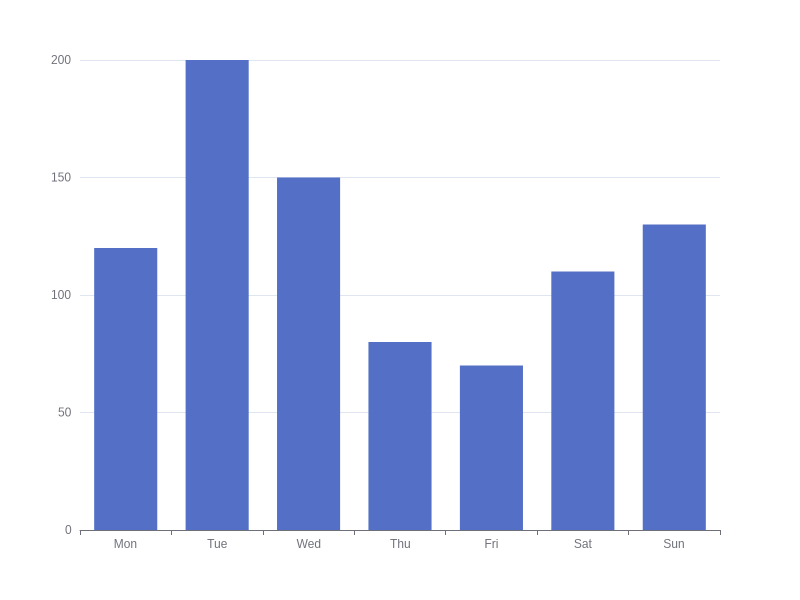
$chart->add_xAxis(
type => 'category',
data => ['Mon', 'Tue', 'Wed', 'Thu', 'Fri', 'Sat', 'Sun']
);
$chart->add_yAxis(type => 'value');
$chart->add_series(
name => 'series_name',
type => 'bar',
data => [120, 200, 150, 80, 70, 110, 130]
);
# Render in HTML
$chart->render_html;
# Render chart image (require Node.js)
$chart->render_image(
output => '/my-path/cool-chart.png',
width => 800,
height => 600
);
```
### Rendered HTML
```.html
let chart_41781780b562926c2c4f3f5ef99f43b381d16726 = echarts.init(document.getElementById('id_41781780b562926c2c4f3f5ef99f43b381d16726'), 'white', {"locale":"en","renderer":"canvas"});
let option_41781780b562926c2c4f3f5ef99f43b381d16726 = {"series":[{"data":[120,200,150,80,70,110,130],"name":"series_name","type":"bar"}],"xAxis":[{"data":["Mon","Tue","Wed","Thu","Fri","Sat","Sun"],"type":"category"}],"yAxis":[{"type":"value"}]};
option_41781780b562926c2c4f3f5ef99f43b381d16726 && chart_41781780b562926c2c4f3f5ef99f43b381d16726.setOption(option_41781780b562926c2c4f3f5ef99f43b381d16726);
```
### Rendered image
## Install
Using Makefile.PL:
To install `Chart::ECharts` distribution, run the following commands.
perl Makefile.PL
make
make test
make install
Using App::cpanminus:
cpanm Chart::ECharts
## Documentation
- https://metacpan.org/release/Chart-ECharts
## Copyright
- Copyright 2024 © Giuseppe Di Terlizzi