https://github.com/giusedroid/aws-serverless-monitoring
A Serverless Monitoring Stack on AWS with Grafana on ECS@Fargate backed by RDS Aurora
https://github.com/giusedroid/aws-serverless-monitoring
aws circleci cloudformation fargate grafana serverless timestream
Last synced: 6 months ago
JSON representation
A Serverless Monitoring Stack on AWS with Grafana on ECS@Fargate backed by RDS Aurora
- Host: GitHub
- URL: https://github.com/giusedroid/aws-serverless-monitoring
- Owner: giusedroid
- License: mit
- Created: 2019-01-10T17:28:16.000Z (over 6 years ago)
- Default Branch: master
- Last Pushed: 2019-03-05T08:12:24.000Z (over 6 years ago)
- Last Synced: 2024-08-01T22:05:01.562Z (about 1 year ago)
- Topics: aws, circleci, cloudformation, fargate, grafana, serverless, timestream
- Language: Makefile
- Homepage:
- Size: 348 KB
- Stars: 12
- Watchers: 4
- Forks: 9
- Open Issues: 15
-
Metadata Files:
- Readme: README.md
- License: LICENSE
Awesome Lists containing this project
README
# aws-serverless-monitoring
[](https://circleci.com/gh/giusedroid/aws-vpc-blueprint)
## What
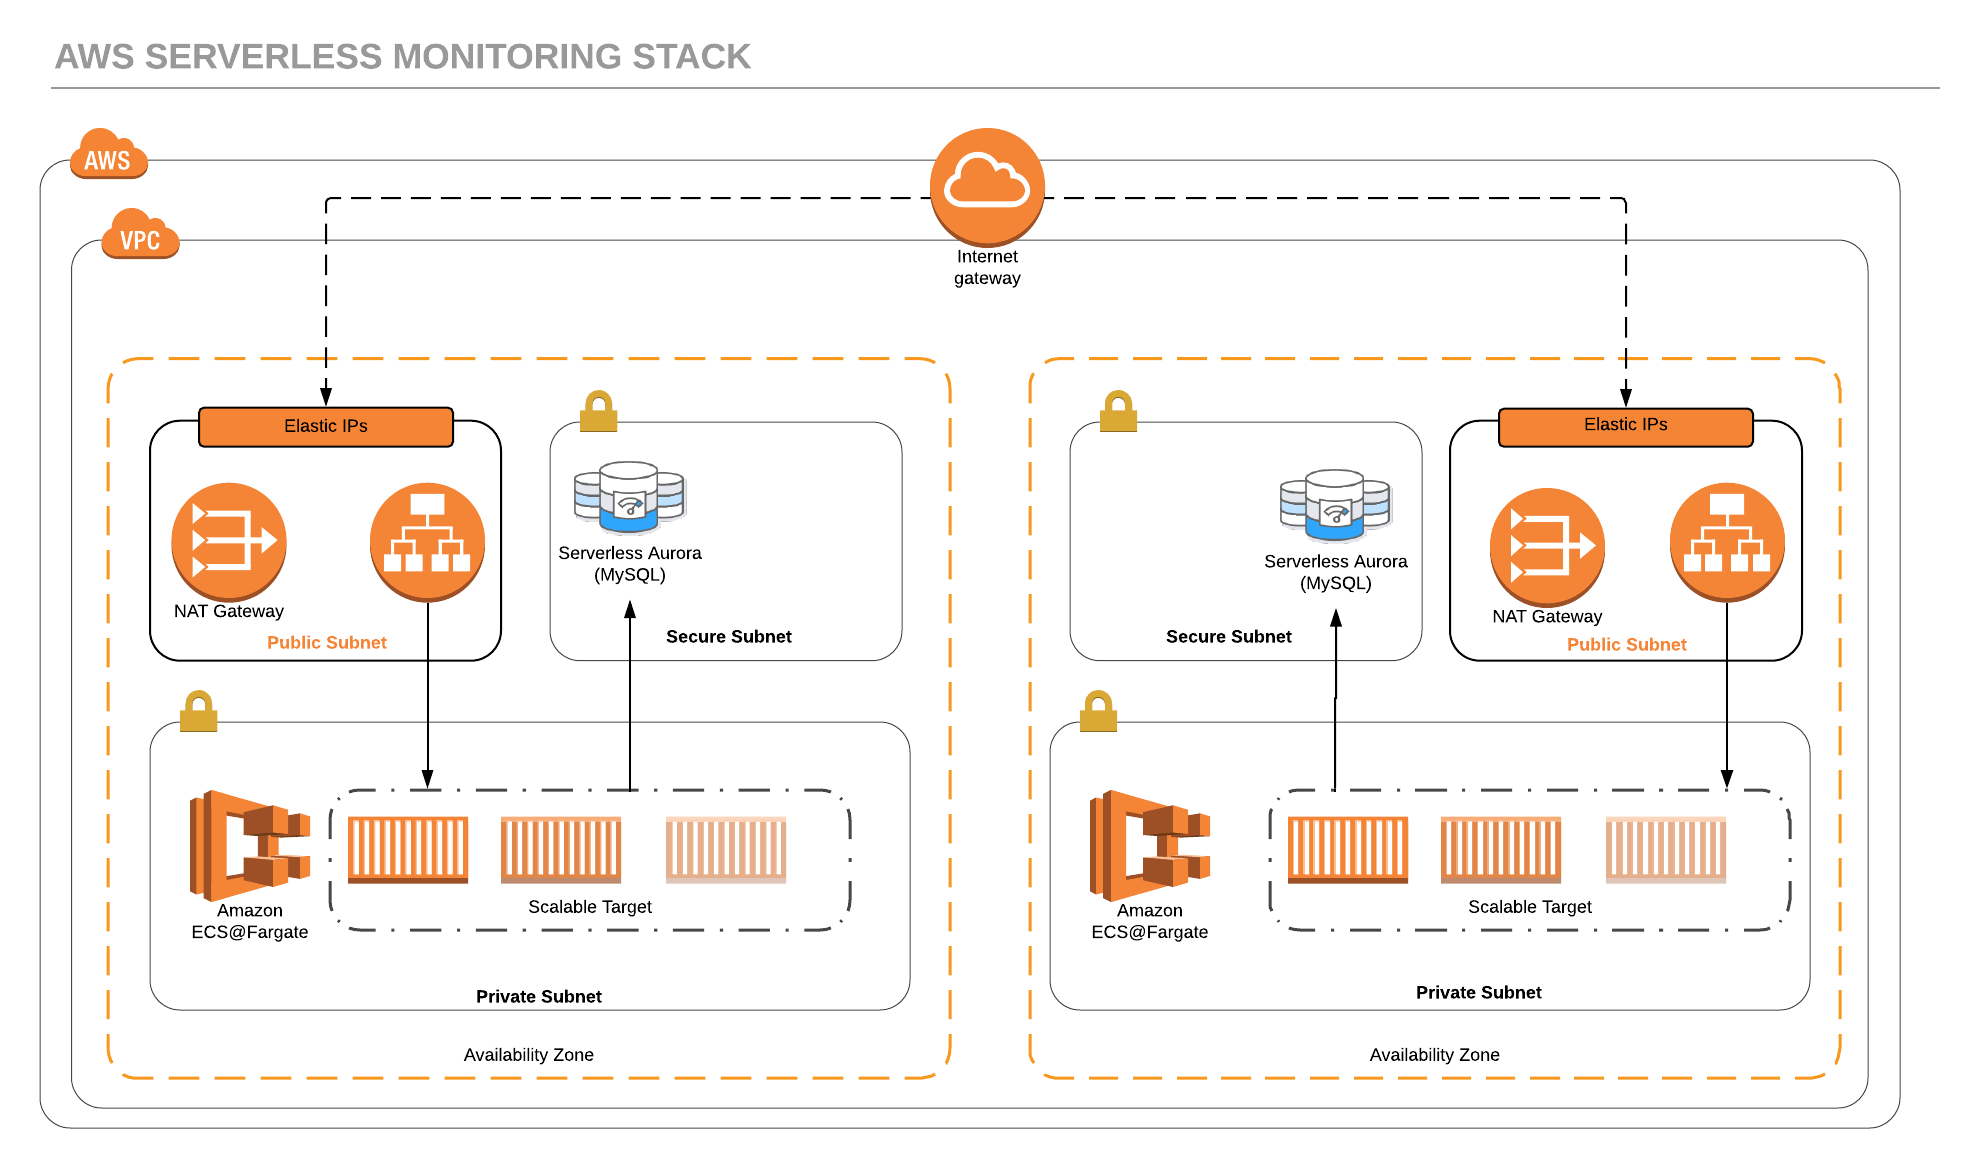
This is an attempt to build a fully serverless monitoring stack.
It deploys [Grafana](https://grafana.com/)
(a nice, highly automatable visualization tool for your metrics and much more)
in HA configuration on AWS ECS@Fargate, backed by AWS RDS Aurora MySQL.
You can use Google OAuth to authenticate your users :)
### Architecture

### CloudFormation Stacks
- **${Environment}-grafana-security** which includes a security group and will be used to export values that are shared with the other stacks.
Deployed via `cloudformation/00-security-and-exports.yml`
- **${Environment}-grafana-backend** is the stack that deploys RDS Aurora MySQL Backend for Grafana HA.
Deployed via `cloudformation/10-aurora-backend.yml`
- **${Environment}-grafana-db-dns** will create DNS records for the RDS Aurora Cluster.
Deployed via `cloudformation/11-dns-aurora.yml`
- **${Environment}-grafana-service** will delpoy Grafana as ECS@Fargate Task.
Deployed via `cloudformation/20-grafana-ecs-service.yml`
- **${Environment}-grafana-dns** will create DNS records for the RDS Aurora Cluster.
Deployed via `cloudformation/21-dns-grafana.yml`
### Future Work
Please have a look at [this repo issues](https://github.com/giusedroid/aws-serverless-monitoring/issues) for further details.
The next milestones are:
- **\[Feature\] :** deploy TimeStream as soon as it's made available, probably using boto(?), Terraform(?), CloudFormation Custom Resources(?)
- **\[Feature\] :** find a way to perform integrity tests on the infrastructure, possibly using something like InSpec(?)
## Why
- I am a huge fan of Grafana
- I am a huge fan of Serverless Technologies
- I am a huge fan of Fargate
- I am tired of managing and monitoring my monitoring infrastructure
- AWS TimeStream, AWS TimeStream, AWS TimeStream
## Environment
Variables that must be in your environment to successfully deploy the stacks.
| Variable Name | Description |
|---------------|-------------|
| AWS_ACCESS_KEY_ID | Your AWS Account Access Key |
| AWS_SECRET_ACCESS_KEY | Your AWS Account Access Secret Key |
| AWS_DEFAULT_REGION | Your Default AWS Region|
| GRAFANA_CERTIFICATE_ARN | The ARN of an SSL certificate to enable HTTPS on your Grafana installation |
| GRAFANA_DATABASE_PASSWORD | Your AWS Aurora master password |
| GRAFANA_DATABASE_PORT | Your Database port |
| GRAFANA_DOMAIN | The top level domain where your installation will be available. For example `crlabs.com` |
| GRAFANA_HOSTED_ZONE | The AWS Route53 HostedZone ID where your `GRAFANA_DOMAIN` is hosted. For example `Z32O1XXXXXXXW2` |
| GRAFANA_SERVICE_ADMIN_PASSWORD | Grafana master user password |
| GRAFANA_SERVICE_ADMIN_USER | Grafana master user name |
| GOOGLE_AUTH_ALLOWED_DOMAINS | Domains that are allowed to authenticate against your installation. For example [cloudreach.com](https://www.cloudreach.com)|
| GOOGLE_AUTH_CLIENT_ID | Your Google OAuth Client id. More info [here](http://docs.grafana.org/auth/google/) |
| GOOGLE_AUTH_CLIENT_SECRET | Your Google OAuth Client Secret. More info [here](http://docs.grafana.org/auth/google/) |
## Imports
This package depends of your AWS account to have the following resources available and their relative Export Values.
| Export Name | Resource |
|-------------------------------- |------------------------------------------------------- |
| ${Environment}-vpc | VPC Id |
| ${Environment}-public-subnets | Comma (,) separated list of public subnet ids |
| ${Environment}-private-subnets | Comma (,) separated list of private subnet ids |
| ${Environment}-data-subnets | Comma (,) separated list of data (private) subnet ids |
Can't be bothered? Feel free to grab this [VPC](https://github.com/giusedroid/aws-vpc-blueprint)
## Exports
What values are exported when this stack is deployed
### Security Stack
The following table lists the exported value when `cloudformation/00-security-and-exports.yml` is deployed.
| Name | Description | Example |
|------|-------------|---------|
| ${Environment}-grafana-sg-id| The id of the security group | sg-027f25***c19a69a9 |
### Aurora Backend
The following table lists the exported value when `cloudformation/10-aurora-backend.yml` is deployed.
| Name | Description | Example |
|------|-------------|---------|
| ${Environment}-grafana-service-aurora-backend-endpoint | The RDS Endpoint for the Aurora Backend | unstable-grafana-service-aurora-backend.cluster-cx**********.eu-west-1.rds.amazonaws.com | |
| ${Environment}-grafana-service-aurora-backend-port | The port at which the database service is made available | 3306 |
| ${Environment}-grafana-database-name | The database name for this service | grafanadb |
| ${Environment}-grafana-database-user | The database master username | grafana_user |
| ${Environment}-grafana-database-sg-id | The id of this RDS cluster security group | sg-*****fd93684744a5 |
### Aurora DNS Records
The following table lists the exported value when `cloudformation/11-dns-aurora.yml` is deployed.
| Name | Description | Example |
|------|-------------|---------|
| ${Environment}-grafana-db-domain | The URL pointing to this RDS Aurora Cluster | grafana-db-stable.appmod.aws.crlabs.cloud |
### Grafana Service
The following table lists the exported value when `cloudformation/20-grafana-ecs-service.yml` is deployed.
| Name | Description | Example |
|------|-------------|---------|
| ${Environment}-grafana-service-lb-dns | The public ALB DNS Record for Grafana Service | stabl-LoadB-XXXXXXXXXXXX-96XXXXX14.eu-west-1.elb.amazonaws.com |
| ${Environment}-grafana-access-role | The ARN of a role that allows your Grafana Installation to access CloudWatch Metrics | arn:aws:iam:::role/GrafanaAccessRole-${Environment} |
| ${Environment}-grafana-service-lb-hosted-zone-id | The hosted zone of the public ALB | Z32O1XXXXXXXW2 |
### Grafana DNS Records
The following table lists the exported value when `cloudformation/21-dns-grafana.yml` is deployed.
| Name | Description | Example |
|------|-------------|---------|
| ${Environment}-grafana-service-domain | The URL pointing to your installation of Grafana | grafana.appmod.aws.crlabs.cloud |
## Sample Dashboards
Sample Dashboards can be found in the `samples/` folder.
Don't forget you can find many more at [Grafana.com](https://grafana.com)
Please refer to [Grafana Docs](http://docs.grafana.org/reference/export_import/) to import dashboards.