https://github.com/go-echarts/go-echarts
🎨 The adorable charts library for Golang.
https://github.com/go-echarts/go-echarts
charts echarts golang-visualization
Last synced: about 1 year ago
JSON representation
🎨 The adorable charts library for Golang.
- Host: GitHub
- URL: https://github.com/go-echarts/go-echarts
- Owner: go-echarts
- License: mit
- Created: 2019-01-10T16:22:41.000Z (over 7 years ago)
- Default Branch: master
- Last Pushed: 2025-05-08T16:28:06.000Z (about 1 year ago)
- Last Synced: 2025-05-12T15:18:31.435Z (about 1 year ago)
- Topics: charts, echarts, golang-visualization
- Language: Go
- Homepage: https://go-echarts.github.io/go-echarts/
- Size: 4.27 MB
- Stars: 7,164
- Watchers: 98
- Forks: 574
- Open Issues: 59
-
Metadata Files:
- Readme: README.md
- License: LICENSE
Awesome Lists containing this project
- awesome-go - go-echarts/go-echarts
- awesome-trevor - Go E-charts - adorable charts library for Golang (Programming / Golang)
- awesome-list - go-echarts - The adorable charts library for Golang. (Containers & Language Extentions & Linting / For Go)
- awesome-starts - go-echarts/go-echarts - 🎨 The adorable charts library for Golang (Go)
- awesomeLibrary - go-echarts
- awesome-go-quant - go-echarts - The adorable charts library for Golang (Golang / Charts/Plot)
- awesome-ccamel - go-echarts/go-echarts - 🎨 The adorable charts library for Golang. (Go)
- my-awesome - go-echarts/go-echarts - visualization pushed_at:2026-07 star:7.6k fork:0.6k 🎨 The adorable charts library for Golang. (Go)
- awesome-quant - go-echarts/go-echarts - 05-11 · license MIT (Utilities)
README

go-echarts
🎨 The adorable charts library for Golang.


> If a language can be used to build web scrapers, it definitely needs to provide a graceful data visualization
> library. --- by dongdong.
In the Golang ecosystem, there are not many choices for data visualization libraries.
The development of [go-echarts](https://github.com/go-echarts/go-echarts) aims to
provide a simple yet powerful data visualization library for Golang.
[Apache ECharts](https://echarts.apache.org/) is an awesome charting and visualization library,
it supports adorable chart types and various interactive features.
and there have many program languages interactive with Echarts, such as [pyecharts](https://github.com/pyecharts/pyecharts),
which `go-echarts` learns and has evolved a lot from, and the [echarts4j](https://github.com/Koooooo-7/echarts4j) either.
[中文 README](README_CN.md)
### 🔰 Installation
Classic way to get go-echarts
```shell
# this may be not a good choice to use v2 go-echarts without gomod(GO111MODULE=off), the
# next generation version management system
# Technically, you could use go-echarts in the way below, if you have a better workaround, please let us know....
$ go get -u github.com/go-echarts/go-echarts/...
$ cd $go-echarts-project
$ mkdir v2 && mv charts components datasets opts render templates types v2
```
Use gomod style
```shell
$ go get -u github.com/go-echarts/go-echarts/v2/...
```
OR
```shell
# go.mod
require github.com/go-echarts/go-echarts/v2
```
### ⏳ Version
The go-echarts project is being developed under v2 version and the active codebase is on the master branch.
v1 and v2 are incompatible which means that you cannot upgrade go-echarts from v1 to v2 smoothly. But I think it is
worth trying that new version.
Especially, when there contains mino changes (usually in enhancement), we will release the `rc` version before a
standard release.
So, if you upgrade your projects cross the `rc` versions, maybe need little adjust, and I believe it is worthy to do.
### ✨ Features
* Clean and comprehensive API.
* Visualize your data in 25+ different ways.
* Highly configurable chart options.
* Detailed documentation and a rich collection of examples.
* Visualize your geographical data with 400+ maps.
### 📝 Usage
It's easy to get started with go-echarts with the [handbook](https://go-echarts.github.io/go-echarts), [go-echarts/examples](https://github.com/go-echarts/examples)
and [GoDocs](https://pkg.go.dev/github.com/go-echarts/go-echarts/v2).
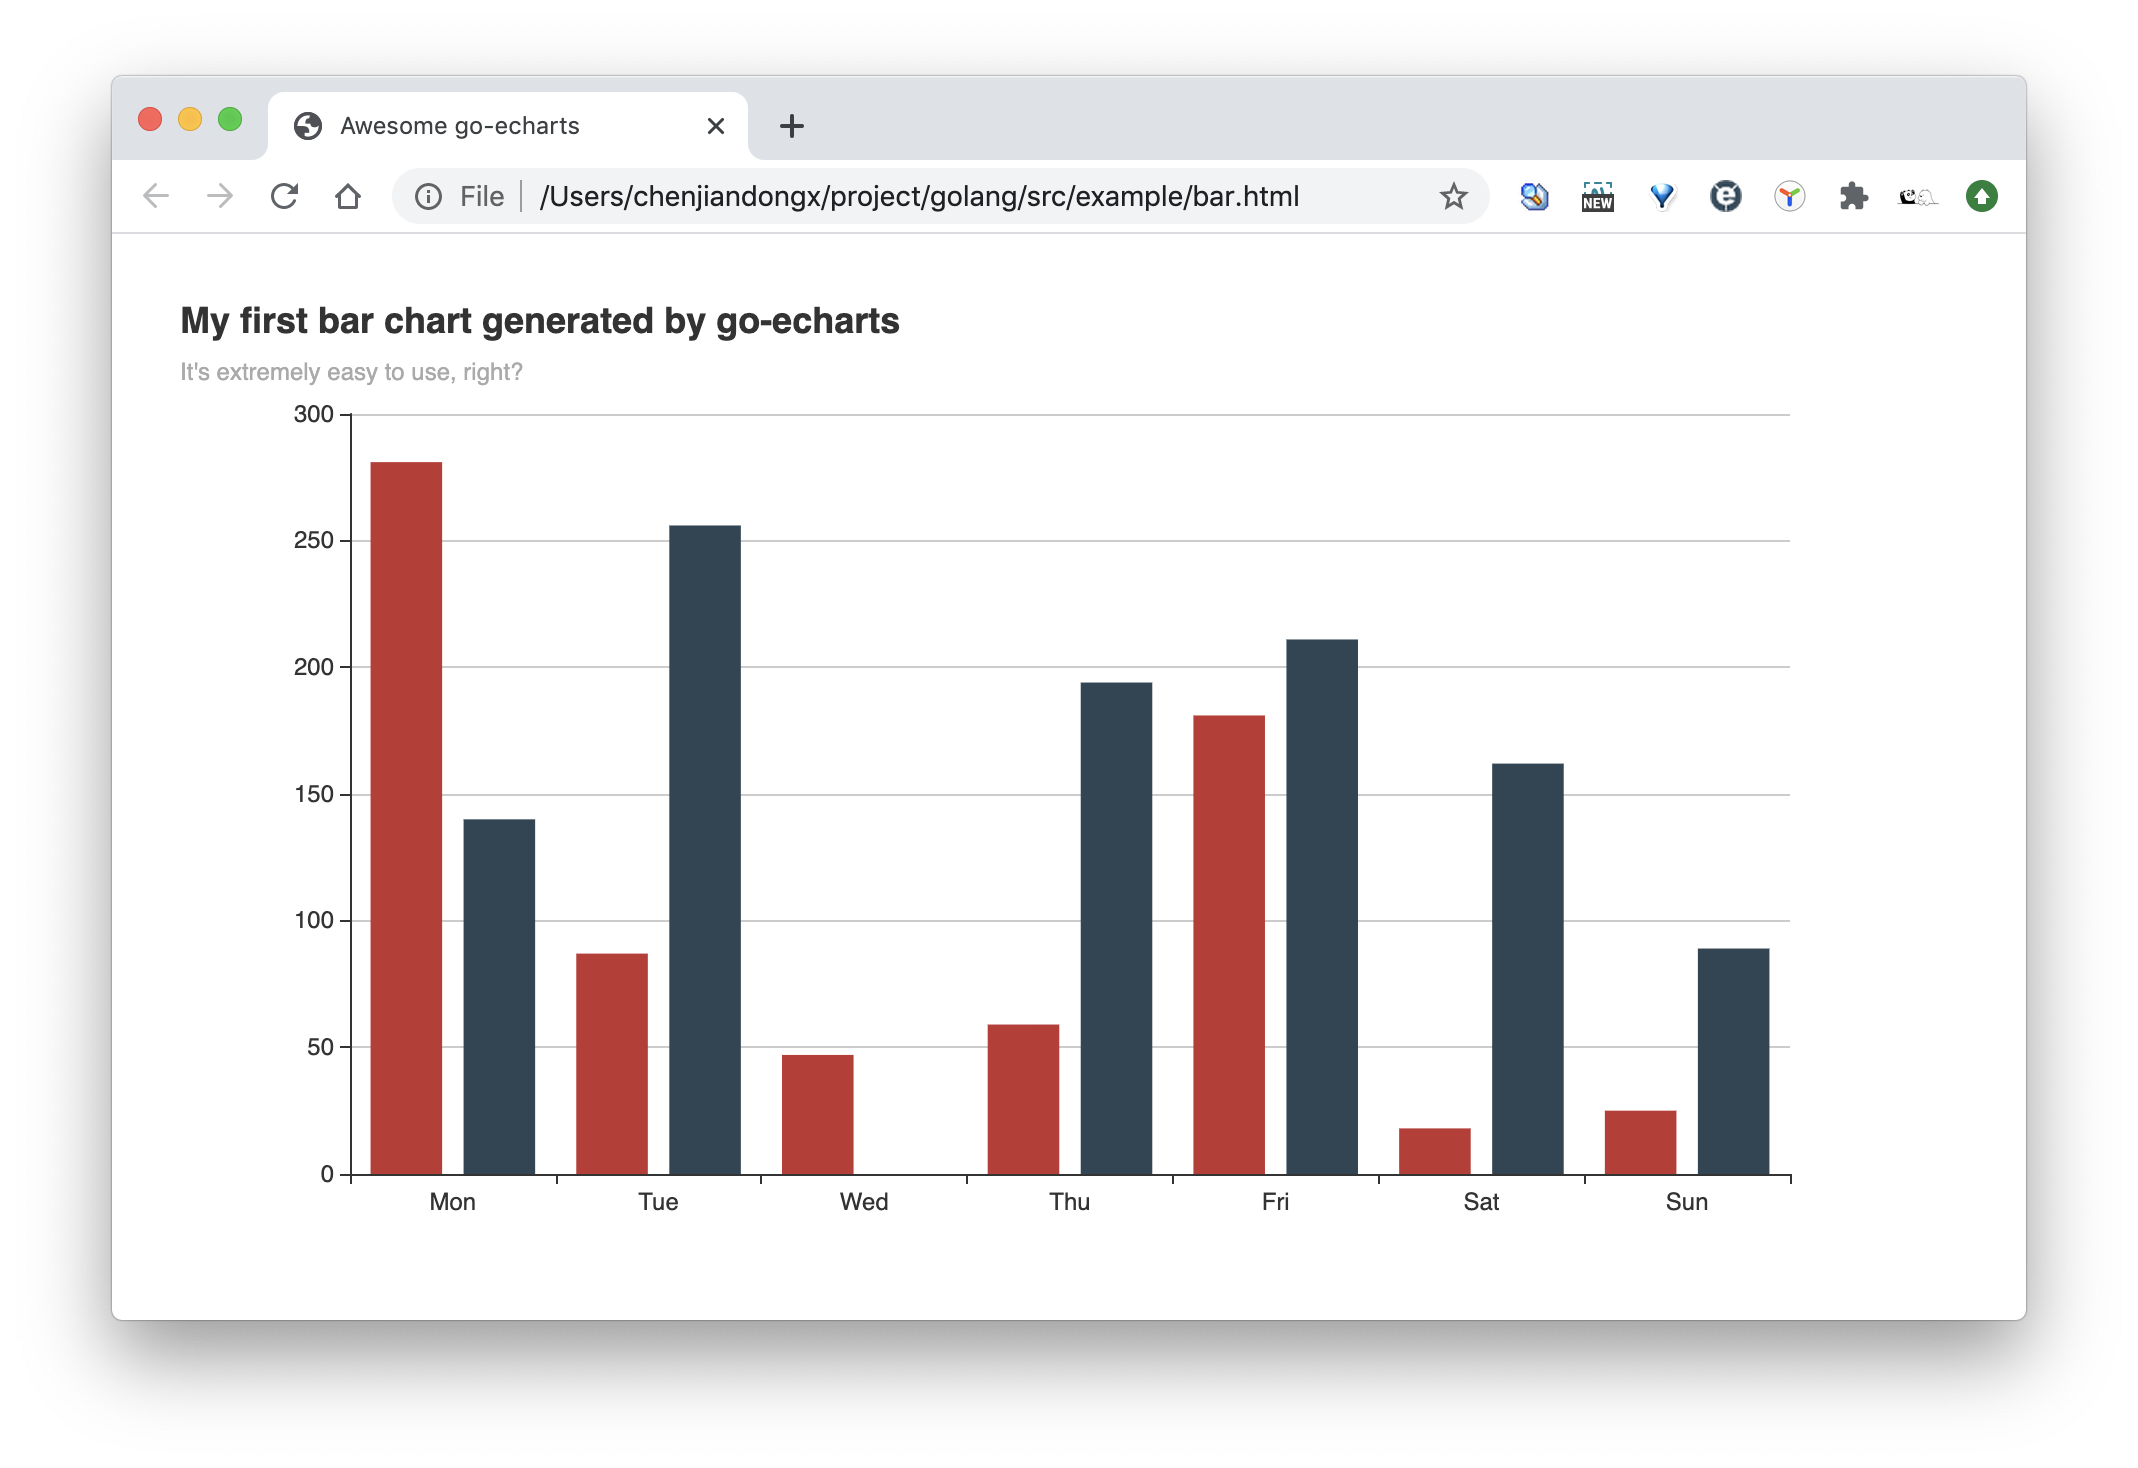
In this example, we create a simple bar chart with only a few lines of code.
```golang
package main
import (
"math/rand"
"os"
"github.com/go-echarts/go-echarts/v2/charts"
"github.com/go-echarts/go-echarts/v2/opts"
)
// generate random data for bar chart
func generateBarItems() []opts.BarData {
items := make([]opts.BarData, 0)
for i := 0; i < 7; i++ {
items = append(items, opts.BarData{Value: rand.Intn(300)})
}
return items
}
func main() {
// create a new bar instance
bar := charts.NewBar()
// set some global options like Title/Legend/ToolTip or anything else
bar.SetGlobalOptions(charts.WithTitleOpts(opts.Title{
Title: "My first bar chart generated by go-echarts",
Subtitle: "It's extremely easy to use, right?",
}))
// Put data into instance
bar.SetXAxis([]string{"Mon", "Tue", "Wed", "Thu", "Fri", "Sat", "Sun"}).
AddSeries("Category A", generateBarItems()).
AddSeries("Category B", generateBarItems())
// Where the magic happens
f, _ := os.Create("bar.html")
bar.Render(f)
}
```
And the generated bar.html is rendered as below. Isn't that cool!
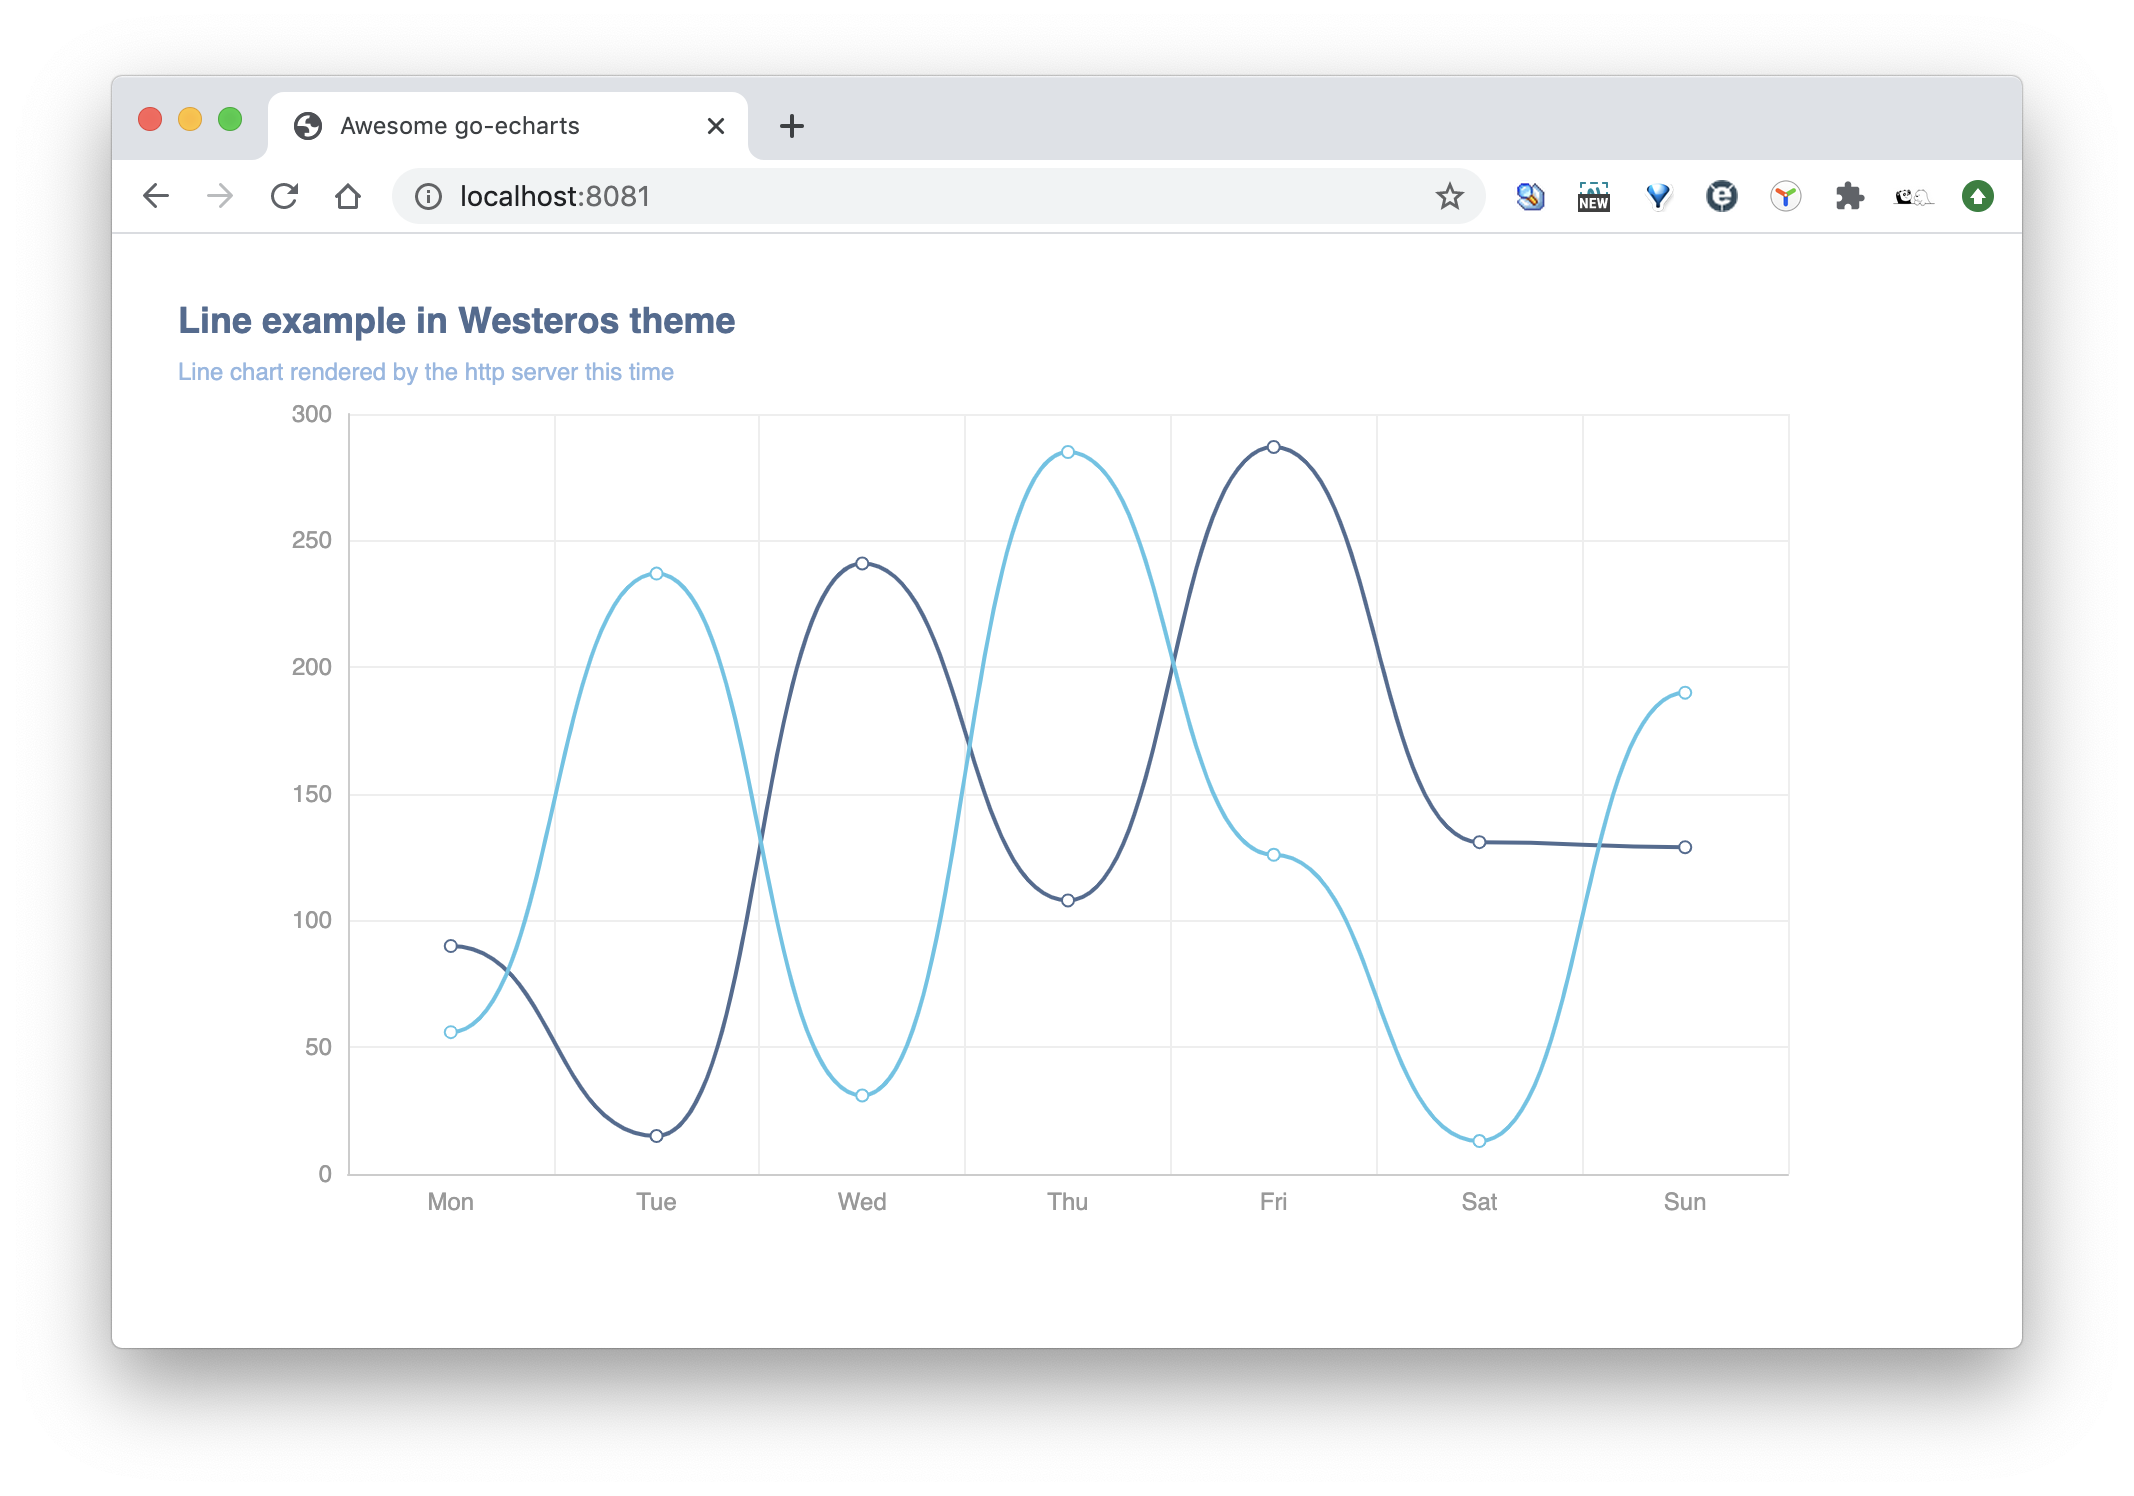
Of course we can also start a listening web server with net/http.
```golang
package main
import (
"math/rand"
"net/http"
"github.com/go-echarts/go-echarts/v2/charts"
"github.com/go-echarts/go-echarts/v2/opts"
"github.com/go-echarts/go-echarts/v2/types"
)
// generate random data for line chart
func generateLineItems() []opts.LineData {
items := make([]opts.LineData, 0)
for i := 0; i < 7; i++ {
items = append(items, opts.LineData{Value: rand.Intn(300)})
}
return items
}
func httpserver(w http.ResponseWriter, _ *http.Request) {
// create a new line instance
line := charts.NewLine()
// set some global options like Title/Legend/ToolTip or anything else
line.SetGlobalOptions(
charts.WithInitializationOpts(opts.Initialization{Theme: types.ThemeWesteros}),
charts.WithTitleOpts(opts.Title{
Title: "Line example in Westeros theme",
Subtitle: "Line chart rendered by the http server this time",
}))
// Put data into instance
line.SetXAxis([]string{"Mon", "Tue", "Wed", "Thu", "Fri", "Sat", "Sun"}).
AddSeries("Category A", generateLineItems()).
AddSeries("Category B", generateLineItems()).
SetSeriesOptions(charts.WithLineChartOpts(opts.LineChart{Smooth: opts.Bool(true)}))
line.Render(w)
}
func main() {
http.HandleFunc("/", httpserver)
http.ListenAndServe(":8081", nil)
}
```
### 🔖 Gallery
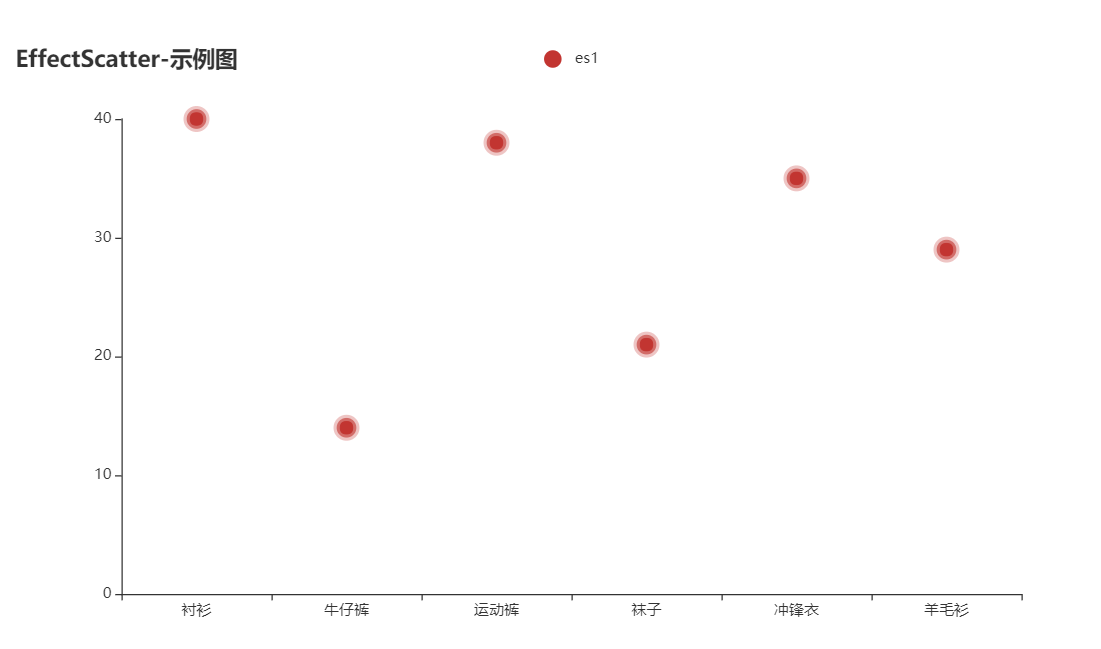
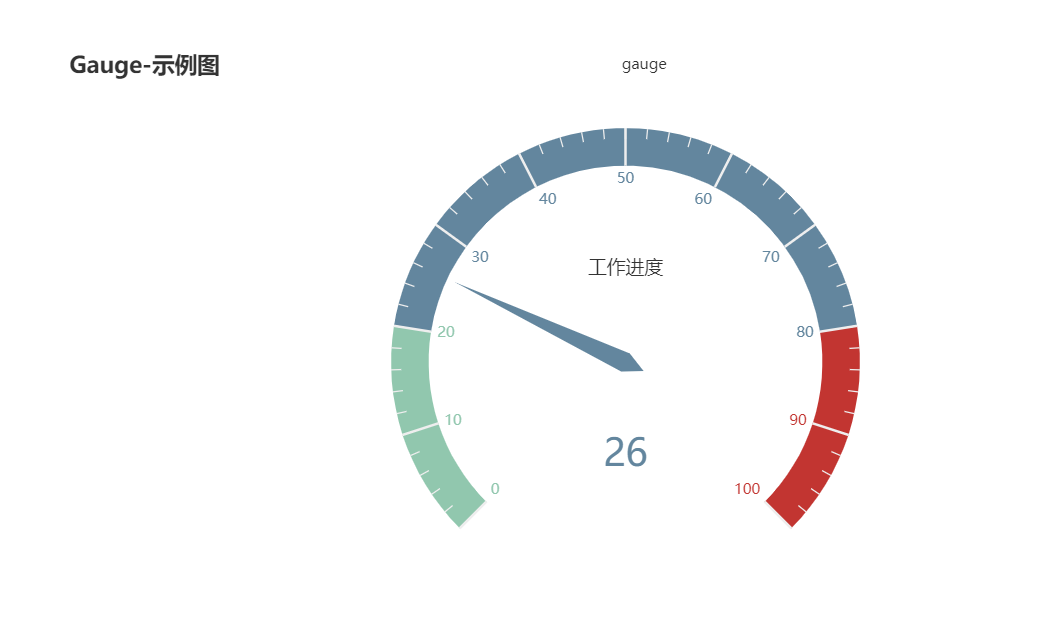
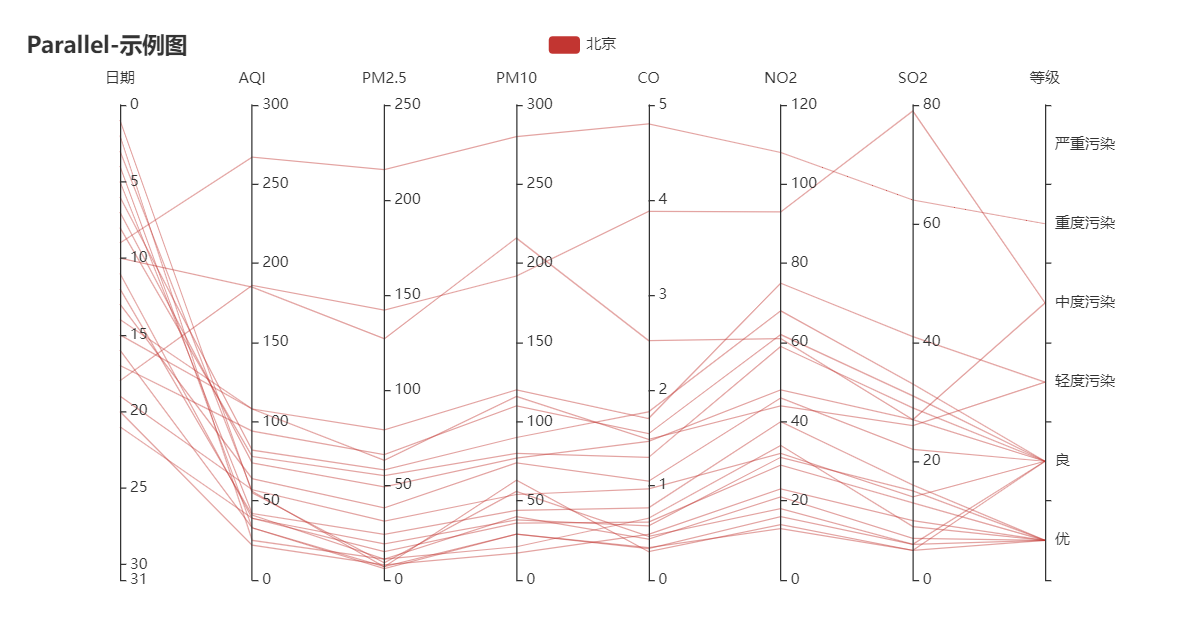
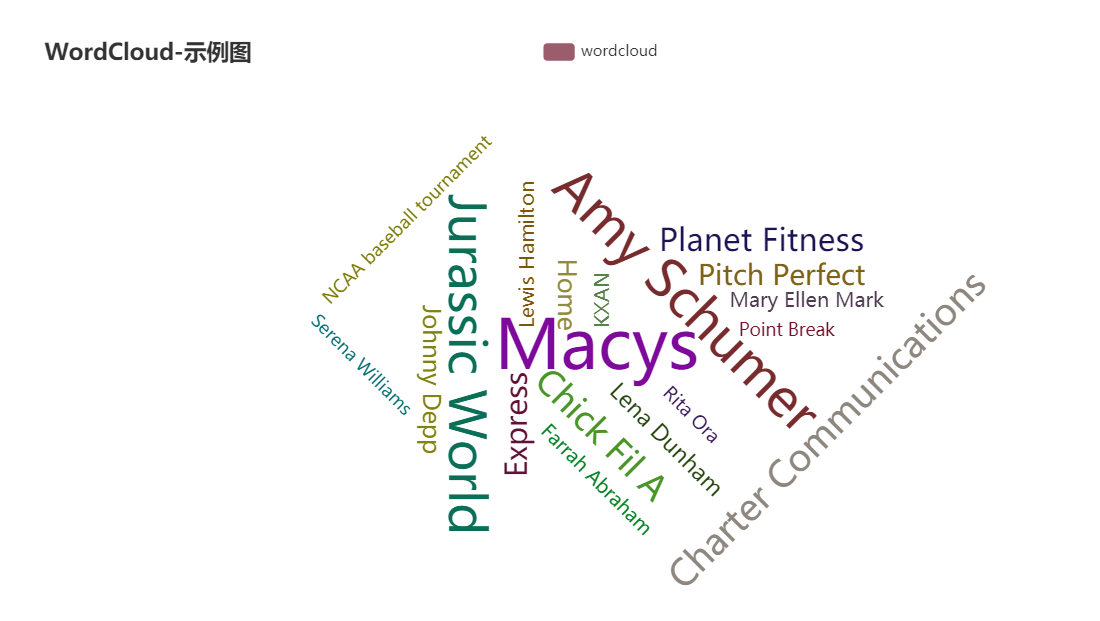
For more information, please refer to [handbook](https://go-echarts.github.io/go-echarts/), [go-echarts/examples](https://github.com/go-echarts/examples) and
the [GoDoc](https://pkg.go.dev/github.com/go-echarts/go-echarts/v2).
### 💡 Contribution
go-echarts is an open source project and built on the top of other open-source projects.
Welcome all the kinds of contributions. No matter it is for typo fix, bug fix or big new features.
Please do not hesitate to ask a question or send a pull request.
We strongly value documentation and integration with other projects, so we are very glad to accept improvements for
these
aspects.
### ❤️ Contributors

### 📃 License
MIT [©go-echarts](https://github.com/go-echarts/go-echarts/blob/master/LICENSE)