Ecosyste.ms: Awesome
An open API service indexing awesome lists of open source software.
https://github.com/grafana/kubernetes-app
A set of dashboards and panels for kubernetes.
https://github.com/grafana/kubernetes-app
grafana kubernetes prometheus
Last synced: 24 days ago
JSON representation
A set of dashboards and panels for kubernetes.
- Host: GitHub
- URL: https://github.com/grafana/kubernetes-app
- Owner: grafana
- License: apache-2.0
- Archived: true
- Created: 2018-01-23T22:14:20.000Z (about 7 years ago)
- Default Branch: master
- Last Pushed: 2021-02-15T08:10:01.000Z (almost 4 years ago)
- Last Synced: 2024-10-28T03:14:53.571Z (4 months ago)
- Topics: grafana, kubernetes, prometheus
- Language: TypeScript
- Homepage: https://grafana.com/plugins/grafana-kubernetes-app
- Size: 4.1 MB
- Stars: 401
- Watchers: 140
- Forks: 149
- Open Issues: 74
-
Metadata Files:
- Readme: README.md
- License: LICENSE
Awesome Lists containing this project
README
# Grafana App for Kubernetes
[Kubernetes](http://kubernetes.io/) is an open-source system for automating deployment, scaling, and management of containerized applications.
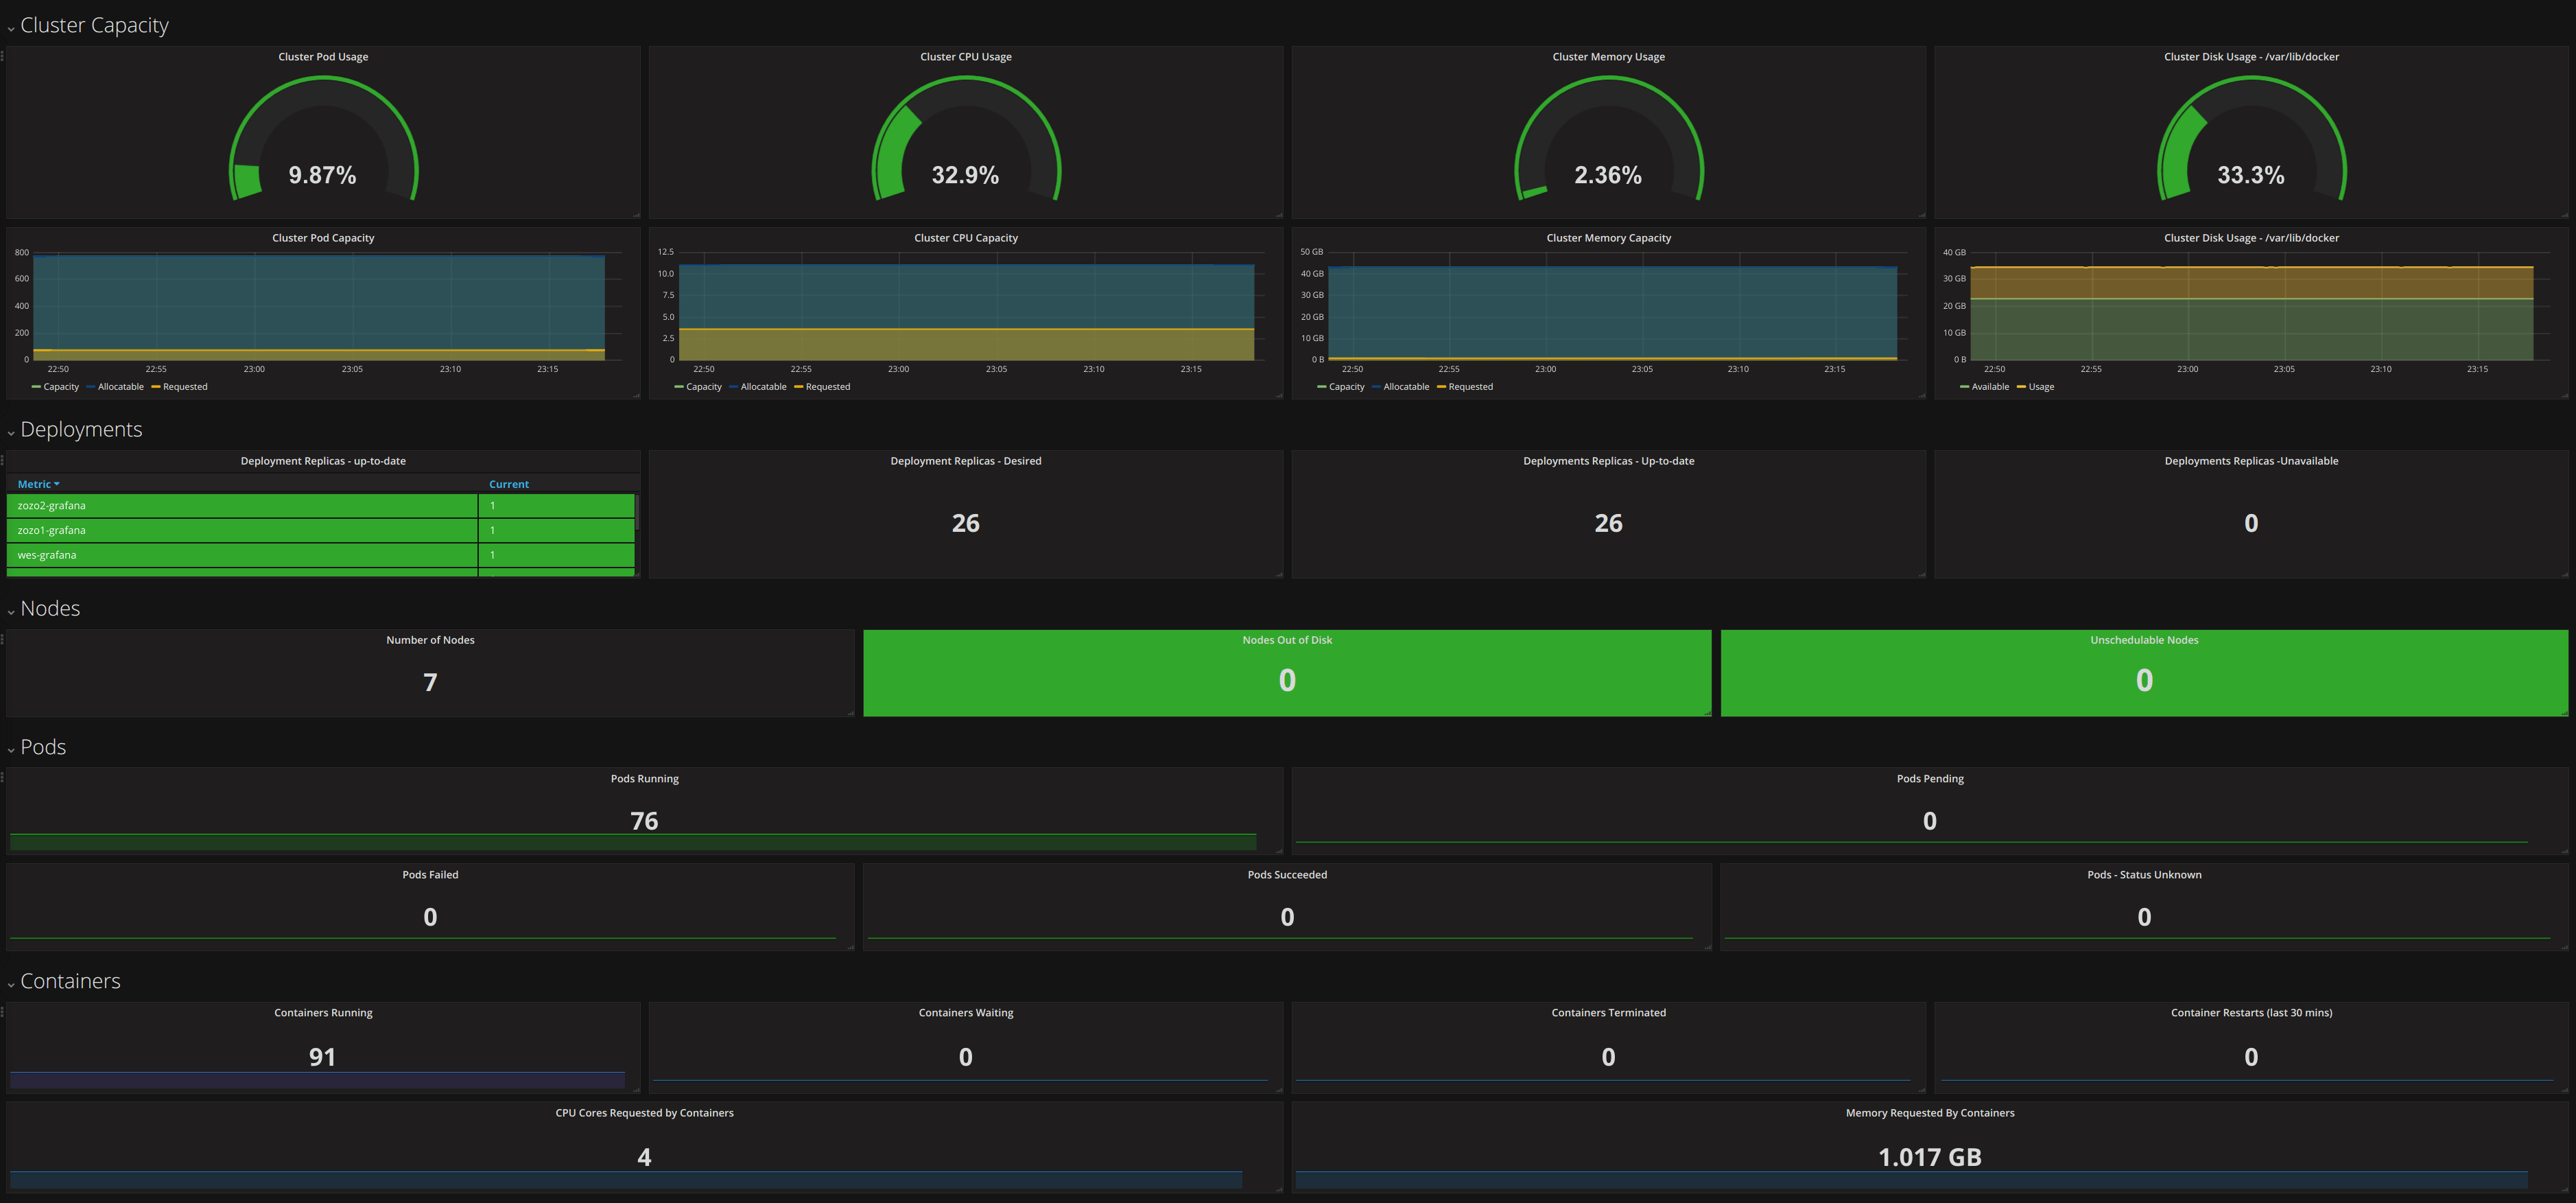
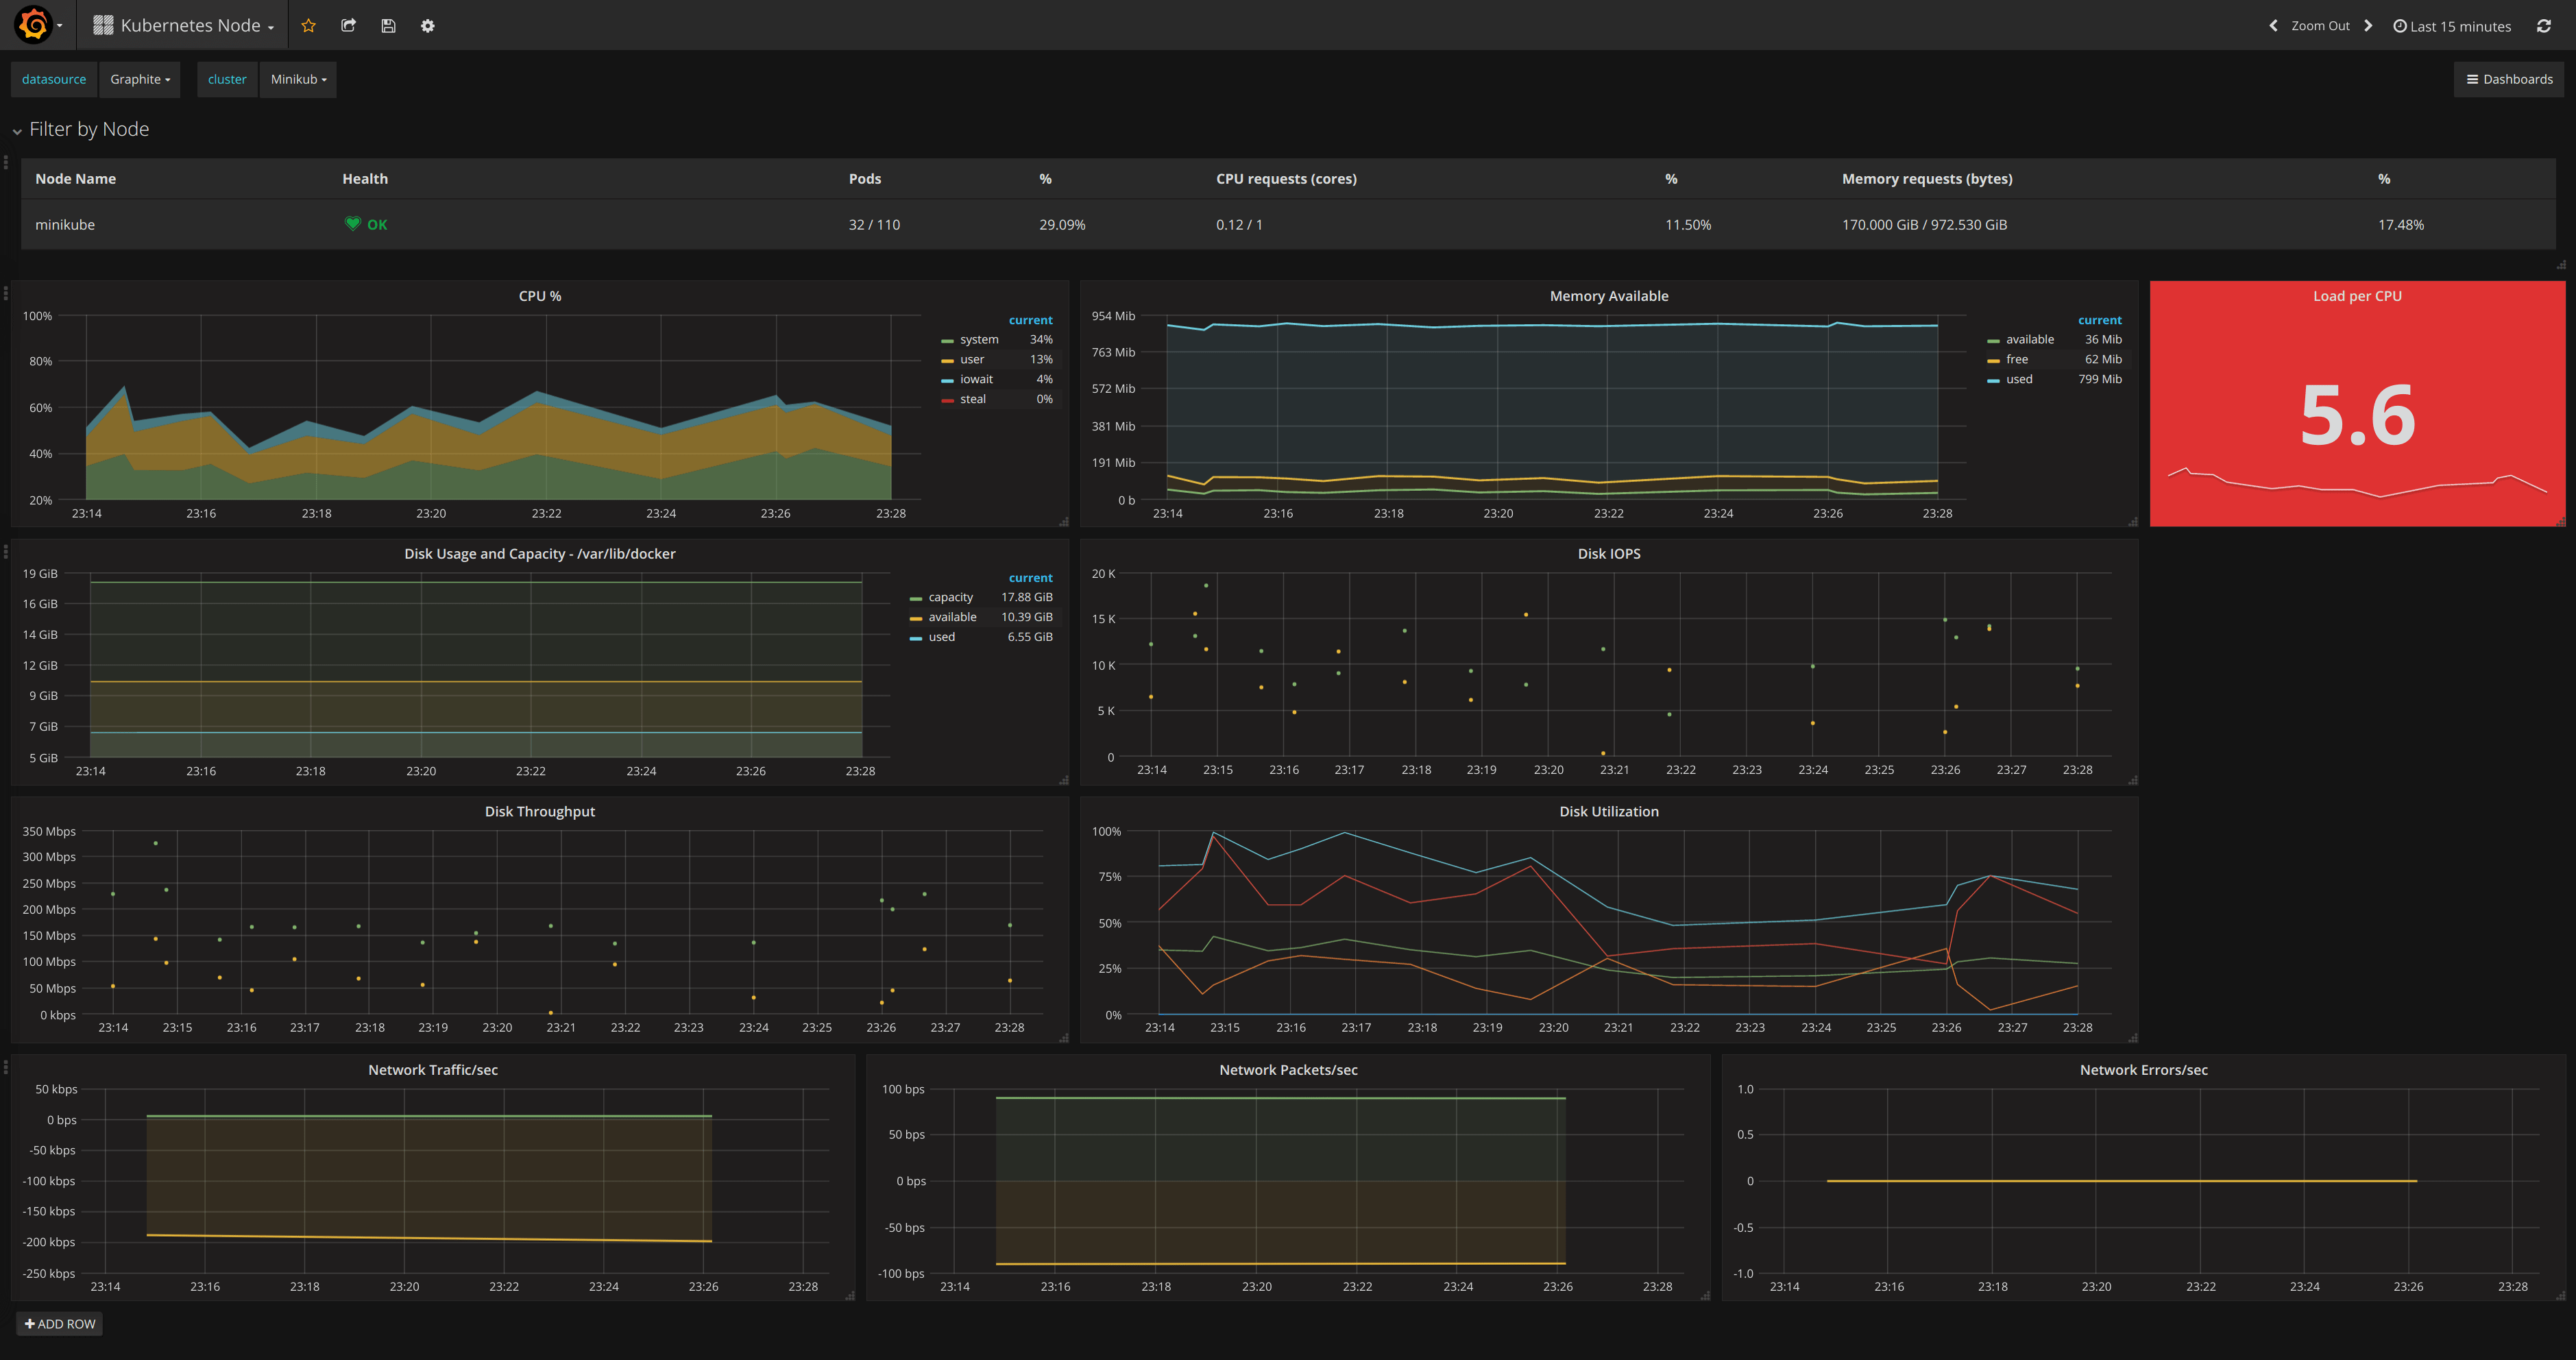
The Grafana Kubernetes App allows you to monitor your Kubernetes cluster's performance. It includes 4 dashboards, Cluster, Node, Pod/Container and Deployment. It allows for the automatic deployment of the required Prometheus exporters and a default scrape config to use with your in cluster Prometheus deployment. The metrics collected are high-level cluster and node stats as well as lower level pod and container stats. Use the high-level metrics to alert on and the low-level metrics to troubleshoot.


### Requirements
1. Currently only has support for [**Prometheus**](https://prometheus.io/docs/prometheus/latest/querying/basics/)
2. For automatic deployment of the exporters, then Kubernetes 1.6 or higher is required.
3. Grafana 5.0.0+
### Features
- The app uses Kubernetes tags to allow you to filter pod metrics. Kubernetes clusters tend to have a lot of pods and a lot of pod metrics. The Pod/Container dashboard leverages the pod tags so you can easily find the relevant pod or pods.
- Easy installation of exporters, either a one click deploy from Grafana or detailed instructions to deploy them manually them with kubectl (also quite easy!)
- Cluster level metrics that are not available in Heapster, like CPU Capacity vs CPU Usage.
### Cluster Metrics
- Pod Capacity/Usage
- Memory Capacity/Usage
- CPU Capacity/Usage
- Disk Capacity/Usage
- Overview of Nodes, Pods and Containers
### Node Metrics
- CPU
- Memory Available
- Load per CPU
- Read IOPS
- Write IOPS
- %Util
- Network Traffic/second
- Network Packets/second
- Network Errors/second
### Pod/Container Metrics
- Memory Usage
- Network Traffic
- CPU Usage
- Read IOPS
- Write IOPS
### Connect your cluster
1. Install the plugin per the [Installation instructions](https://grafana.com/grafana/plugins/grafana-kubernetes-app/installation).
1. Go to the Cluster List page via the Kubernetes app menu.

1. Click the `New Cluster` button.
1. Fill in the Auth details for your cluster.
TLS certs/keys must be provided in plaintext, not base64 encoded form. For example:
```
-----BEGIN CERTIFICATE-----
MIQWQtAEFeqqfAFeAEGEQWIGNwEQNFGQ4AEFN35AKWadgAENGqiEGNIWm1QETDGF
...
-----END CERTIFICATE-----
```
1. Choose the Prometheus datasource that will be used for reading data in the dashboards.
1. Click `Deploy`. This will deploy a Node Exporter DaemonSet, to collect health metrics for every node, and a Deployment that collects cluster metrics.
### Feedback and Questions
Please submit any issues with the app on [Github](https://github.com/grafana/kubernetes-app/issues).