https://github.com/grafana/otel-profiling-go
Open Telemetry integration for Grafana Pyroscope and tracing solutions such as Grafana Tempo, Honeycomb, or Jaeger
https://github.com/grafana/otel-profiling-go
go honeycomb honeycombio jaeger opentelemetry opentracing optimization performance pprof profiler profiling trace tracing
Last synced: 3 months ago
JSON representation
Open Telemetry integration for Grafana Pyroscope and tracing solutions such as Grafana Tempo, Honeycomb, or Jaeger
- Host: GitHub
- URL: https://github.com/grafana/otel-profiling-go
- Owner: grafana
- License: apache-2.0
- Created: 2022-02-28T22:32:56.000Z (almost 4 years ago)
- Default Branch: main
- Last Pushed: 2024-12-12T15:33:19.000Z (about 1 year ago)
- Last Synced: 2025-03-31T04:07:18.999Z (9 months ago)
- Topics: go, honeycomb, honeycombio, jaeger, opentelemetry, opentracing, optimization, performance, pprof, profiler, profiling, trace, tracing
- Language: Go
- Homepage: https://pyroscope.io
- Size: 34.2 KB
- Stars: 93
- Watchers: 7
- Forks: 2
- Open Issues: 1
-
Metadata Files:
- Readme: README.md
- License: LICENSE
Awesome Lists containing this project
README
# Profiling Instrumentation for OpenTelemetry Go SDK
**NOTE**: This is an experimental package -- and will be officially supported in future versions of Pyroscope
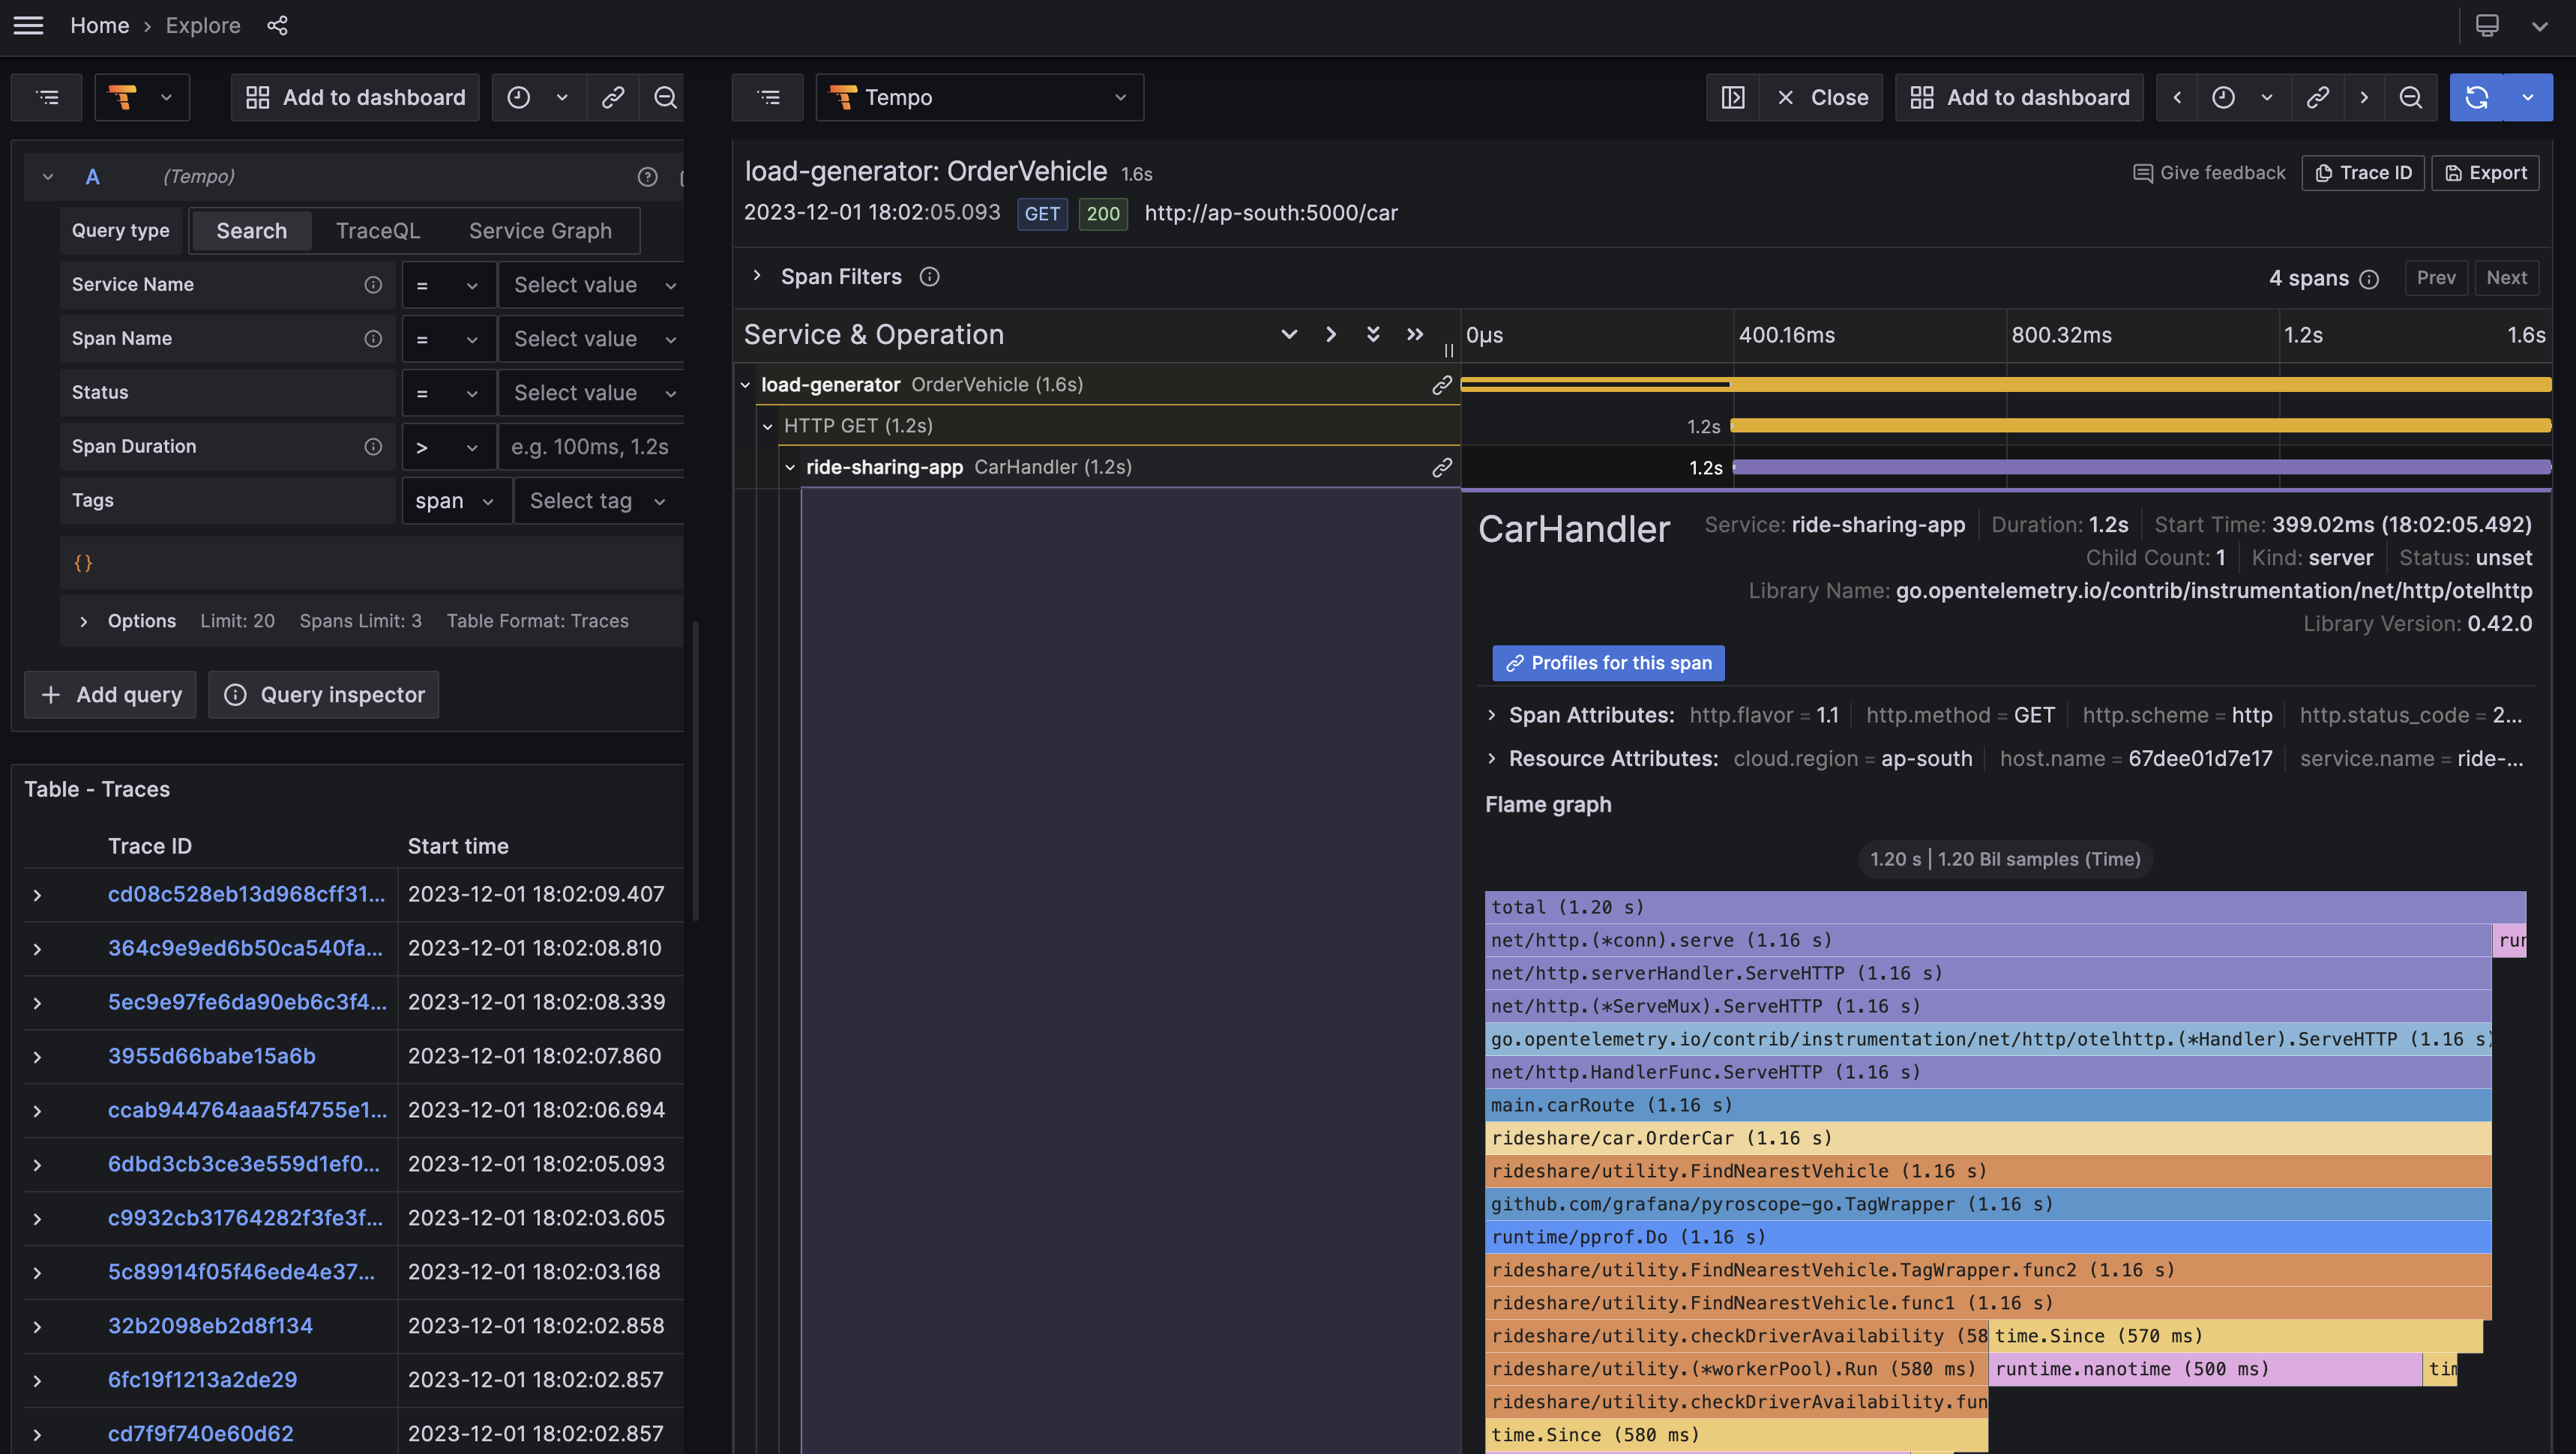
The package provides means to integrate tracing with profiling. More specifically, a `TracerProvider` implementation,
that annotates profiling data with span IDs: when a new trace span emerges, the tracer adds a `span_id` [pprof tag](https://github.com/google/pprof/blob/master/doc/README.md#tag-filtering)
that points to the span. This makes it possible to filter out a profile of a particular trace span in [Pyroscope](https://pyroscope.io).
Note that the module does not control `pprof` profiler itself – it still needs to be started for profiles to be
collected. This can be done either via `runtime/pprof` package, or using the [Pyroscope client](https://github.com/grafana/pyroscope-go).
By default, only the root span gets labeled (the first span created locally): such spans are marked with the
`pyroscope.profile.id` attribute set to the span ID. Please note that presence of the attribute does not necessarily
indicate that the span has a profile: stack trace samples might not be collected, if the utilized CPU time is
less than the sample interval (10ms).
Limitations:
- Only CPU profiling is fully supported at the moment.
### Trace spans profiles
To start profiling trace spans, you need to include our go module in your app:
```
go get github.com/grafana/otel-profiling-go
```
Then add the pyroscope tracer provider:
```go
package main
import (
otelpyroscope "github.com/grafana/otel-profiling-go"
"github.com/grafana/pyroscope-go"
)
func main() {
// Initialize your tracer provider as usual.
tp := initTracer()
// Wrap it with otelpyroscope tracer provider.
otel.SetTracerProvider(otelpyroscope.NewTracerProvider(tp))
// If you're using Pyroscope Go SDK, initialize pyroscope profiler.
_, _ = pyroscope.Start(pyroscope.Config{
ApplicationName: "my-service",
ServerAddress: "http://localhost:4040",
})
// Your code goes here.
}
```
Tracing integration is supported in pull mode as well: if you scrape profiles using Grafana Agent, you should
make sure that the pyroscope `service_name` label matches `service.name` attribute specified in the OTel SDK configuration.
Please refer to the [Grafana Agent](https://grafana.com/docs/pyroscope/latest/configure-client/grafana-agent/go_pull/)
documentation to learn more.
## Example
You can find a complete example setup with Grafana Tempo in the [Pyroscope repository](https://github.com/grafana/pyroscope/tree/main/examples/tracing/golang-push).
