https://github.com/grafana/pyroscope
Continuous Profiling Platform. Debug performance issues down to a single line of code
https://github.com/grafana/pyroscope
continuous-profiling developer-tools devops find-bottlenecks golang hacktoberfest linux monitoring observability performance profiling pyroscope python ruby
Last synced: 3 months ago
JSON representation
Continuous Profiling Platform. Debug performance issues down to a single line of code
- Host: GitHub
- URL: https://github.com/grafana/pyroscope
- Owner: grafana
- License: agpl-3.0
- Created: 2020-12-31T05:47:19.000Z (over 5 years ago)
- Default Branch: main
- Last Pushed: 2025-05-02T16:57:16.000Z (about 1 year ago)
- Last Synced: 2025-05-03T07:12:53.330Z (about 1 year ago)
- Topics: continuous-profiling, developer-tools, devops, find-bottlenecks, golang, hacktoberfest, linux, monitoring, observability, performance, profiling, pyroscope, python, ruby
- Language: Go
- Homepage: https://grafana.com/oss/pyroscope/
- Size: 197 MB
- Stars: 10,519
- Watchers: 97
- Forks: 645
- Open Issues: 362
-
Metadata Files:
- Readme: README.md
- Changelog: CHANGELOG.md
- License: LICENSE
- Code of conduct: CODE_OF_CONDUCT.md
- Codeowners: CODEOWNERS
- Governance: GOVERNANCE.md
Awesome Lists containing this project
- awesome-go - grafana/pyroscope
- awesome-ops - grafana/pyroscope - 3.0|11013|2020-12-31|2025-11-07 | 性能分析平台,用于分析 CPU 利用率和内存泄漏等应用性能问题 | (性能分析)
- awesome-cloud-native - Pyroscope - Continuous profiling with flame graphs and differential profiling — compare today's deployment to yesterday's and find which function started eating CPU. Part of Grafana Labs, supports SDK-based and eBPF collection across most languages. (📊 Observability / 🔥 Continuous Profiling)
- StarryDivineSky - grafana/pyroscope
- awesome-open-source-alternatives - grafana/pyroscope
- awesome-performance-engineering - Grafana Pyroscope - ⭐🟢🔵 Continuous profiling with flame graph visualization and multi-language support. (Observability / Profiling & Continuous Performance Analysis)
- my-awesome - grafana/pyroscope - profiling,developer-tools,devops,find-bottlenecks,golang,hacktoberfest,linux,monitoring,observability,performance,profiling,pyroscope,python,ruby pushed_at:2026-05 star:11.4k fork:0.7k Continuous Profiling Platform. Debug performance issues down to a single line of code (Go)
README

[](https://github.com/grafana/pyroscope/actions/workflows/test.yml)
[](https://github.com/grafana/pyroscope/actions?query=workflow%3AJS%20Tests)
[](https://goreportcard.com/report/github.com/grafana/pyroscope)
[](LICENSE)
[](https://app.fossa.com/projects/git%2Bgithub.com%2Fgrafana%2Fpyroscope?ref=badge_shield)
[](https://github.com/grafana/pyroscope/releases)
[](https://hub.docker.com/r/grafana/pyroscope)
[](https://godoc.org/github.com/grafana/pyroscope)
## 🎉 **Announcement: The new Explore Profiles UI is here!**
We are thrilled to announce the launch of the **Explore Profiles UI**, a brand-new way to explore and analyze your profiling data—now available as part of the Grafana Explore Apps suite! This new app brings you a **queryless**, **intuitive** experience for visualizing your profiling data, simplifying the entire process without the need to write complex queries.
https://github.com/user-attachments/assets/4db19ec7-86f3-4701-8f5f-9b7ffcebd49c
## What is Grafana Pyroscope?
Grafana Pyroscope is a continuous profiling platform designed to surface performance insights from your applications, helping you optimize resource usage such as CPU, memory, and I/O operations. With Pyroscope, you can both **proactively** and **reactively** address performance bottlenecks across your system.
The typical use cases are:
- **Proactive:** Reducing resource consumption, improving application performance, or preventing latency issues.
- **Reactive:** Quickly resolving incidents with line-level detail and debugging active CPU, memory, or I/O bottlenecks.
Pyroscope provides powerful tools to give you a comprehensive view of your application's behavior while allowing you to drill down into specific services for more targeted root cause analysis.
## How Does Pyroscope Work?

Pyroscope consists of three main components:
- **Pyroscope Server:** The server component that stores and processes profiling data.
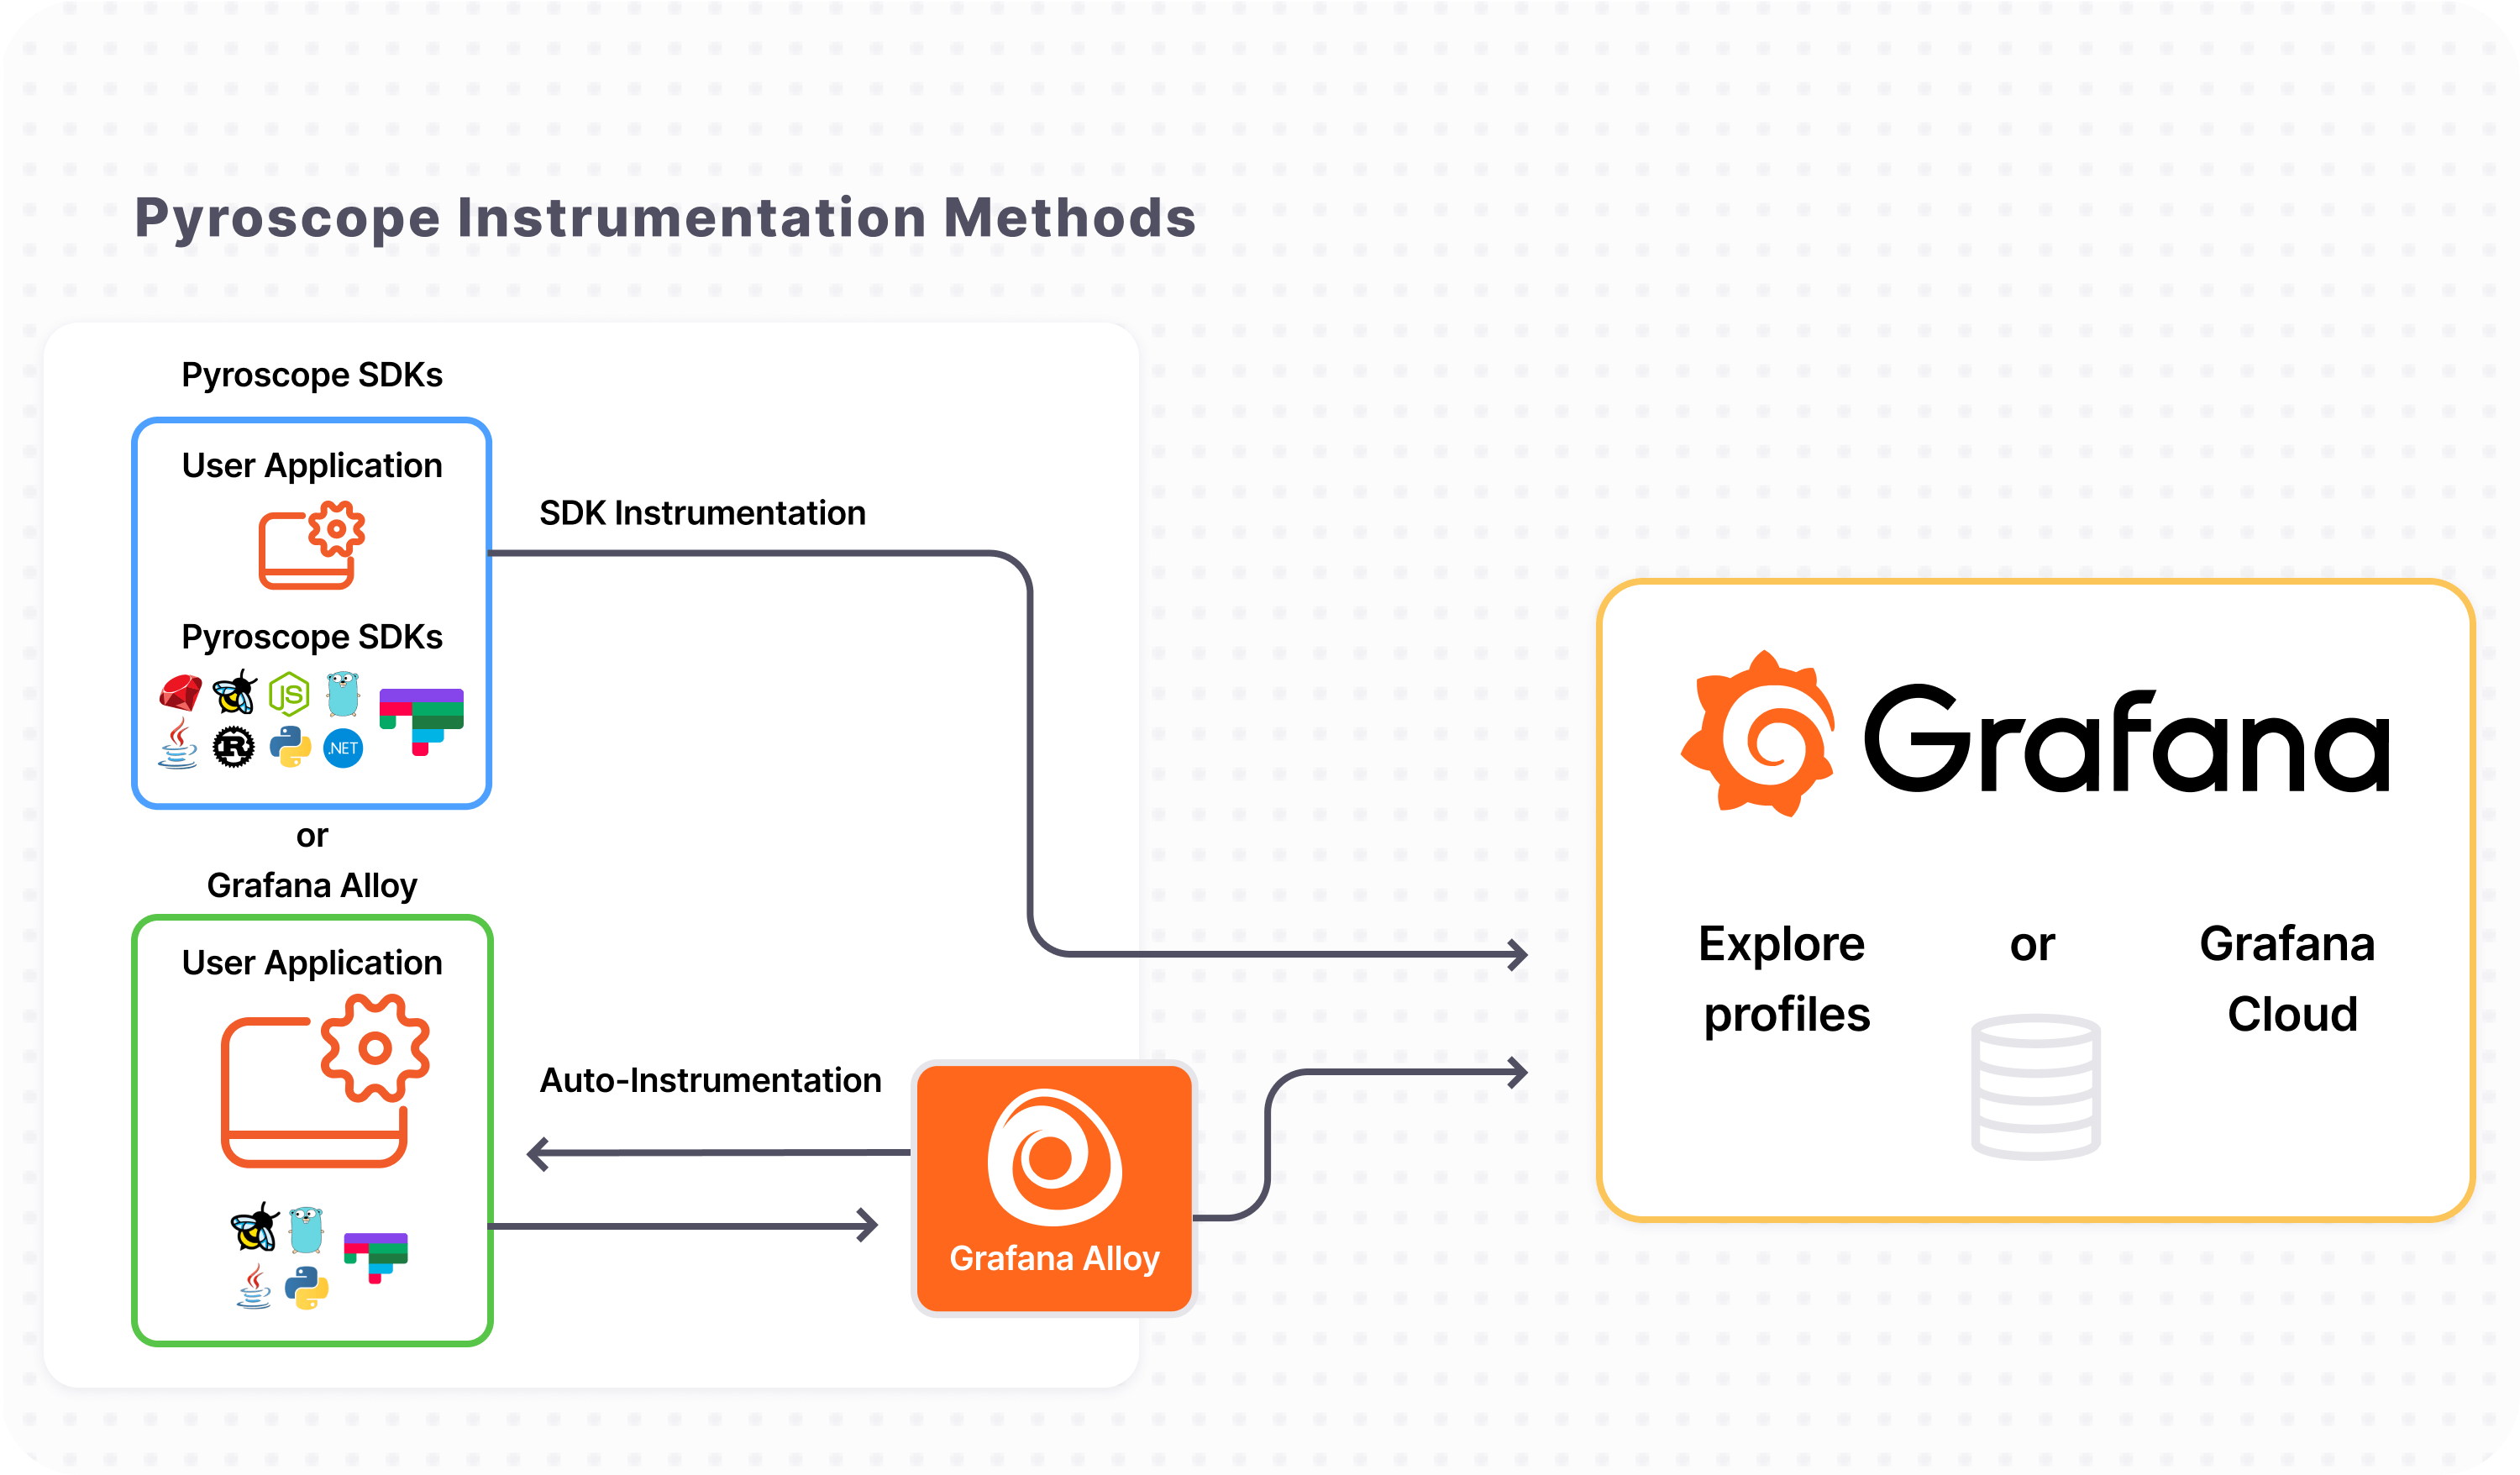
- **Pyroscope SDKs(push) or Grafana alloy(pull) :** The client-side part of Pyroscope that collects profiling data from your applications and sends it to the server.
- **Explore Profiles UI:** A queryless, intuitive UI for visualizing and analyzing profiling data.
---
## [Pyroscope Live Demo](https://play.grafana.org/a/grafana-pyroscope-app/)
[](https://play.grafana.org/a/grafana-pyroscope-app/)
---
## **Quick Start: Run Pyroscope server locally**
### Homebrew
```sh
brew install pyroscope-io/brew/pyroscope
brew services start pyroscope
```
### Docker
```sh
docker run -it -p 4040:4040 grafana/pyroscope
```
For more documentation on how to configure Pyroscope server, see [our server documentation](https://grafana.com/docs/pyroscope/latest/configure-server/).
## **Quick Start: Run Explore Profiles UI in Grafana**

### Grafana Cloud
The app UI and server are both installed and running automatically -- just start sending data!
### Grafana OSS
You can run the Explore profiles UI in Grafana by installing the plugin from the [Grafana Plugin Directory](https://grafana.com/grafana/plugins/grafana-pyroscope-app/)
For more information, check out the [Explore Profiles README](https://github.com/grafana/explore-profiles)
## Documentation
For more information on how to use Pyroscope with other programming languages, install it on Linux, or use it in production environment, check out our documentation:
* [Getting Started](https://grafana.com/docs/pyroscope/latest/get-started/)
* [Deployment Guide](https://grafana.com/docs/pyroscope/latest/deploy-kubernetes/)
* [Pyroscope Architecture](https://grafana.com/docs/pyroscope/latest/reference-pyroscope-architecture/)
## Send data to server via Pyroscope agent (language specific)
For more documentation on how to add the Pyroscope agent to your code, see the [agent documentation](https://grafana.com/docs/pyroscope/latest/configure-client/) on our website or find language specific examples and documentation below:

Golang
Documentation
Examples

Java
Documentation
Examples

Python
Documentation
Examples

Ruby
Documentation
Examples

Node.js
Documentation
Examples

.NET
Documentation
Examples

eBPF
Documentation
Examples

Rust
Documentation
Examples
## [Supported Languages][supported languages]
Our documentation contains the most recent list of [supported languages] and also an overview over what [profiling types are supported per language][profile-types-languages].
Let us know what other integrations you want to see in [our issues](https://github.com/grafana/pyroscope/issues?q=is%3Aissue+is%3Aopen+label%3Anew-profilers) or in [our slack](https://slack.grafana.com).
[supported languages]: https://grafana.com/docs/pyroscope/latest/configure-client/
[profile-types-languages]: https://grafana.com/docs/pyroscope/latest/configure-client/profile-types/
## Credits
Pyroscope is possible thanks to the excellent work of many people, including but not limited to:
* Brendan Gregg — inventor of Flame Graphs
* Julia Evans — creator of rbspy — sampling profiler for Ruby
* Vladimir Agafonkin — creator of flamebearer — fast flame graph renderer
* Ben Frederickson — creator of py-spy — sampling profiler for Python
* Adam Saponara — creator of phpspy — sampling profiler for PHP
* Alexei Starovoitov, Daniel Borkmann, and many others who made BPF based profiling in Linux kernel possible
* Jamie Wong — creator of speedscope — interactive flame graph visualizer
## Contributing
To start contributing, check out our [Contributing Guide](docs/internal/contributing/README.md)
### Thanks to the contributors of Pyroscope!
[//]: contributor-faces