https://github.com/gz/autoperf
Simplify the use of performance counters.
https://github.com/gz/autoperf
intel perf performance performance-counters performance-metrics performance-monitoring performance-visualization x86 x86-64
Last synced: 5 months ago
JSON representation
Simplify the use of performance counters.
- Host: GitHub
- URL: https://github.com/gz/autoperf
- Owner: gz
- License: mit
- Created: 2016-08-26T14:47:48.000Z (almost 10 years ago)
- Default Branch: master
- Last Pushed: 2022-04-25T03:01:15.000Z (about 4 years ago)
- Last Synced: 2024-11-24T03:31:34.395Z (over 1 year ago)
- Topics: intel, perf, performance, performance-counters, performance-metrics, performance-monitoring, performance-visualization, x86, x86-64
- Language: Rust
- Homepage: https://docs.rs/autoperf
- Size: 4.4 MB
- Stars: 62
- Watchers: 4
- Forks: 3
- Open Issues: 2
-
Metadata Files:
- Readme: README.md
- License: LICENSE
Awesome Lists containing this project
README
[](https://travis-ci.org/gz/autoperf)
[](https://crates.io/crates/autoperf)
[](https://docs.rs/crate/autoperf/)
# autoperf
autoperf simplifies the instrumentation of programs with performance
counters on Intel machines. Rather than trying to learn how to measure every
event and manually programming event values in counter registers or perf, you
can use autoperf which will repeatedly run your program until it has measured
every single performance event on your machine. autoperf tries to compute a
schedule that maximizes the amount of events measured per run, and
minimizes the total number of runs while avoiding multiplexing of events on
counters.

## Background
Performance monitoring units typically distinguish between performance events and counters.
Events refer to observations on the micro-architectural level
(e.g., a TLB miss, a page-walk etc.), whereas counters are hardware registers that
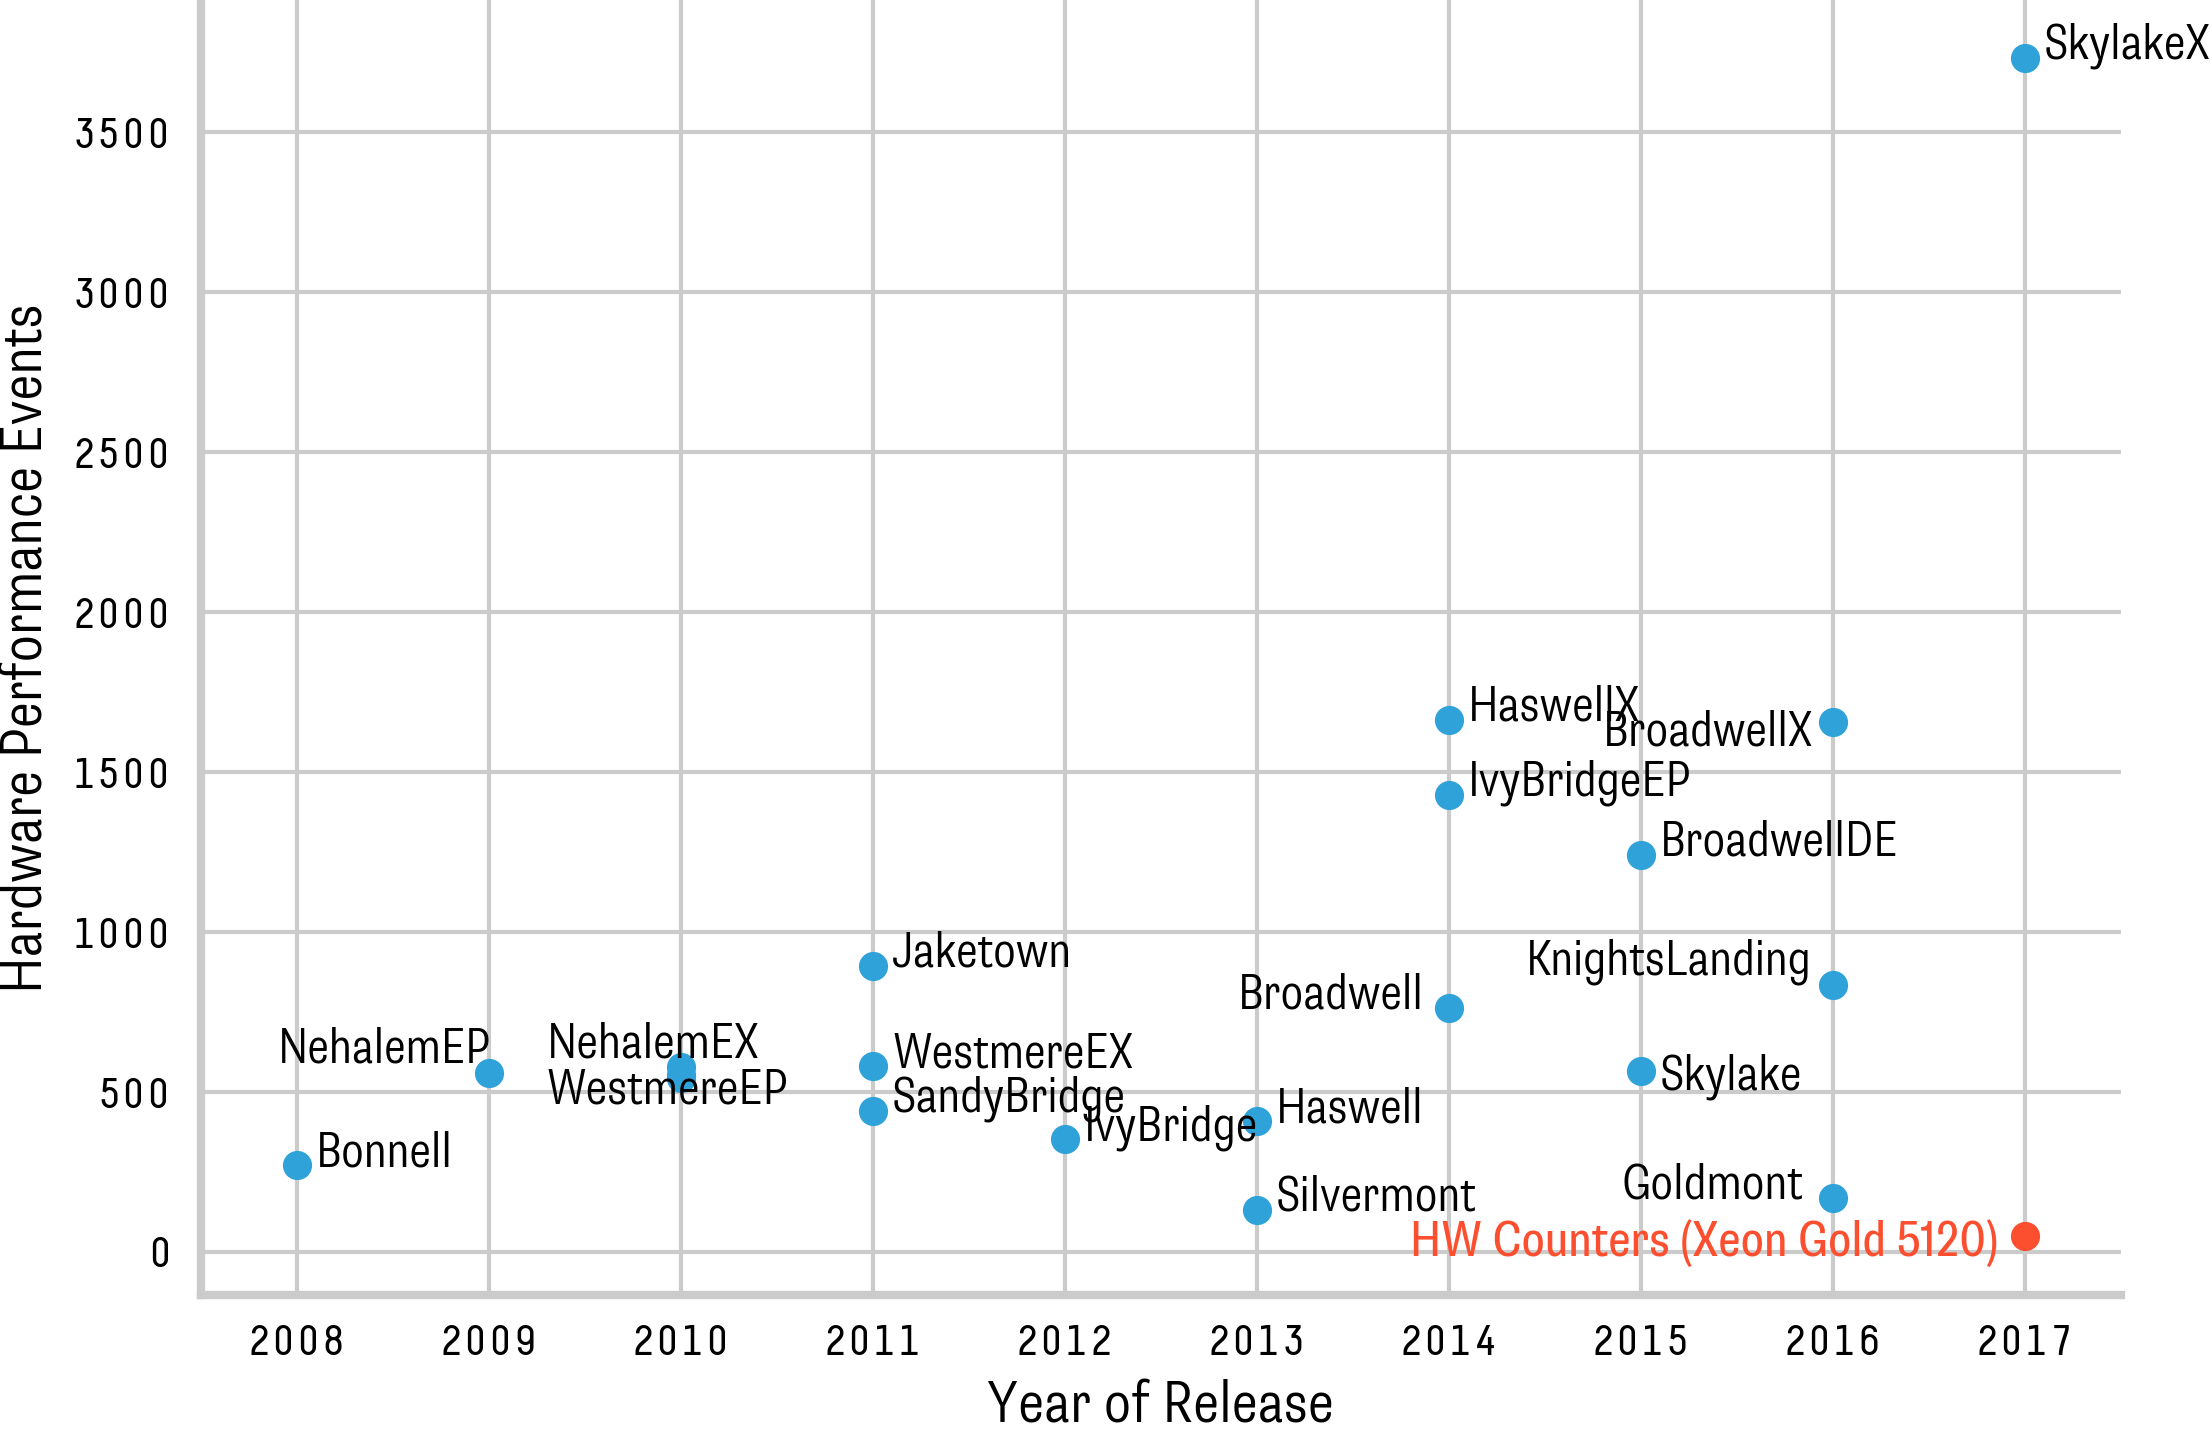
count the occurrence of events. The figure on the right shows the number of different
observable events for different Intel micro-architectures. Note that current systems
provide a very large choice of possible events to monitor. The number of measurable
counters per PMU is limited (typically from two to eight). For example, if the same
events are measured on all PMUs on a SkylakeX (Xeon Gold 5120) machine, we can only
observe a maximum of 48 different events (without sampling). autoperf simplifies the process
of fully measuring and recording every performance event for a given program.
In our screen session above, recorded on a SkylakeX machine with ~3500 distinct events,
we can see how autoperf automatically runs a program 1357 times while measuring and recording
a different set of events in every run.
# Installation
autoperf is known to work with Ubuntu 18.04 on Skylake and
IvyBridge/SandyBridge architectures. All Intel architectures should work,
please file a bug request if it doesn't. autoperf builds on `perf` from the
Linux project and a few other libraries that can be installed using:
```
$ sudo apt-get update
$ sudo apt-get install likwid cpuid hwloc numactl util-linux
```
To run the example analysis scripts, you'll need these python3 libraries:
```
$ pip3 install ascii_graph matplotlib pandas argparse numpy
```
You'll also need the *nightly version* of the rust compiler which is
best installed using rustup:
```
$ curl https://sh.rustup.rs -sSf | sh -s -- -y --default-toolchain nightly
$ source $HOME/.cargo/env
```
autoperf is published on crates.io, so once you have rust and cargo installed,
you can get it directly from there:
```
$ cargo +nightly install autoperf
```
Or alternatively, clone and build the repository yourself:
```
$ git clone https://github.com/gz/autoperf.git
$ cd autoperf
$ cargo build --release
$ ./target/release/autoperf --help
```
autoperf uses perf internally to interface with Linux and the performance
counter hardware. perf recommends that the following settings are disabled.
Therefore, autoperf will check the values of those configurations and refuse to
start if they are not set like below:
```
sudo sh -c 'echo 0 >> /proc/sys/kernel/kptr_restrict'
sudo sh -c 'echo 0 > /proc/sys/kernel/nmi_watchdog'
sudo sh -c 'echo -1 > /proc/sys/kernel/perf_event_paranoid'
```
# Usage
autoperf has a few commands, use `--help` to get a better overview of all the
options.
## Profiling
The **profile** command instruments a single program by running it multiple times
until every performance event is measured. For example,
```
$ autoperf profile sleep 2
```
will repeatedly run `sleep 2` while measuring different performance events
with performance counters every time. Once completed, you will find an `out`
folder with many csv files that contain measurements from individual runs.
## Aggregating results
To combine all those runs into a single CSV result file you can use the
**aggregate** command:
```
$ autoperf aggregate ./out
```
This will do some sanity checking and produce a `results.csv`
([reduced example](../master/doc/results.csv)) file which contains
all the measured data.
## Analyze results
Performance events are measured individually on every core (and other
monitoring units). The `timeseries.py` can aggregate events by taking the
average, stddef, min, max etc. and producing a time-series matrix ([see a
reduced example](../master/doc/timeseries.csv)).
```
python3 analyze/profile/timeseries.py ./out
```
Now you have all the data, so you can start asking some questions. As an
example, the following script tells you how events were correlated
when your program was running:
```
$ python3 analyze/profile/correlation.py ./out
$ open out/correlation_heatmap.png
```
Event correlation for the `autoperf profile sleep 2` command
above looks like this (every dot represents the correlation of the timeseries
between two measured performance events, this is from a Skylake machine with
around 1700 non-zero event measurement):

You can look at individual events too:
```
python3 analyze/profile/event_detail.py --resultdir ./out --features AVG.OFFCORE_RESPONSE.ALL_RFO.L3_MISS.REMOTE_HIT_FORWARD
```

There are more scripts in the `analyze` folder to better work with the captured
data-sets. Have a look.
## What do I use this for?
autoperf allows you to quickly gather lots of performance (or training) data and
reason about it quantitatively. For example, we initially developed autoperf to
build ML classifiers that the Barrelfish scheduler could use for detecting
application slowdown and make better scheduling decisions. autoperf can gather
that data to generate such classifiers without requiring domain knowledge about
events, aside from how to measure them.
You can read more about our experiments here:
* https://dl.acm.org/citation.cfm?id=2967360.2967375
* https://www.research-collection.ethz.ch/handle/20.500.11850/155854
Last but not least, autoperf can potentially be useful in many other scenarios:
* Find out what performance events are relevant for your workload
* Analyzing and finding performance issues in your code or with different versions of your code
* Generate classifiers to detect hardware exploits (side channels/spectre/meltdown etc.)
* ...