https://github.com/hadif1999/pycoin
a lovable data analysis and algorithmic trading library for cryptocurrencies
https://github.com/hadif1999/pycoin
algorithmic-trading crypto-trading-bot cryptobot cryptocurrencies cryptocurrency cryptocurrency-exchanges quantitative-finance quantitative-trading tradebot trading trading-bot trading-strategies
Last synced: about 2 months ago
JSON representation
a lovable data analysis and algorithmic trading library for cryptocurrencies
- Host: GitHub
- URL: https://github.com/hadif1999/pycoin
- Owner: hadif1999
- Created: 2023-05-13T19:29:11.000Z (about 3 years ago)
- Default Branch: master
- Last Pushed: 2024-05-29T10:41:04.000Z (about 2 years ago)
- Last Synced: 2025-09-29T08:11:59.823Z (10 months ago)
- Topics: algorithmic-trading, crypto-trading-bot, cryptobot, cryptocurrencies, cryptocurrency, cryptocurrency-exchanges, quantitative-finance, quantitative-trading, tradebot, trading, trading-bot, trading-strategies
- Language: Python
- Homepage: https://pypi.org/project/pythoncoin/
- Size: 19.5 MB
- Stars: 9
- Watchers: 2
- Forks: 1
- Open Issues: 0
-
Metadata Files:
- Readme: README.md
Awesome Lists containing this project
README

# Pycoin
## a lovable data analysis and algorithmic trading library for cryptocurrencies :moneybag:
including tools for deploying any strategy including pattern based strategies,
Price Action strategies, Indicator based strategies and also Machine learning based strategies.
able to run multi strategy instances on a single bot as a webapp and a lot more...
## what can this package do:
- [x] download market historical data for all symbols from almost all exchanges thanks to [ccxt](https://github.com/ccxt/ccxt) :chart_with_upwards_trend:
- [x] visualizing capabilities to easily analyze market using [plotly](https://github.com/plotly/plotly.py) :chart_with_downwards_trend:
- [x] able to perform some useful analysis such as finding market trend according to market past high and lows, finding market important levels (like support and resistance) and more :bar_chart:
- [ ] able to define your strategy, backtest it, run it in dry run mode and also in real mode :mag: (soon)
- [ ] using telegram bot and webapp to control and monitor your bot :robot: (soon)
- [ ] run multiple strategy instances for each user as a single bot. (soon)
>[!NOTE]
>**for usage examples please checkout [examples](https://github.com/hadif1999/pycoin/tree/master/examples) folder and open provided notebooks and run each cell.**
## Installation
>[!NOTE]
> for installation on Google Colab notebook please refer to **installation on google colab** section
### via cloning (recommended)
```bash
pip install -e git+https://github.com/hadif1999/pycoin.git#egg="pythoncoin"
```
if you need extra dependencies such as ploting or AI packages add **[extra]**(name of extra dependency that will be mentioned below) to end of "pythoncoin" (keep using quotes)
example of installing plotting and jupyter dependencies:
```bash
pip install -e git+https://github.com/hadif1999/pycoin.git#egg="pythoncoin[jupyter,plot]"
```
**please be careful not to use spaces between extra packages list**
available extra packages:
- **plot**: installs packages related to plotting.
- **jupyter**: installs packages related to using in jupyter notebook.
- **ai**: installs packages related to using AI features.
- **hdf5**: installs packages related to big data features.
- **all**: installs all available dependencies.
### installing from PyPI
#### installation with standard dependencies
```bash
!pip install "pythoncoin"
```
#### installation with extra dependencies
```bash
!pip install "pythoncoin[plot]"
```
as mentioned earlier you can also use **ai**, **plot**, **jupyter**, **hdf5** or **all** to install needed extra dependencies.
### installation on Google Colab
before using above installation methods on Google Colab first you have to install ta-lib
properly using conda, you use a conda alternative for colab like [condacolab](https://github.com/conda-incubator/condacolab).
```python
!pip install -q condacolab
import condacolab
condacolab.install()
!conda install -c conda-forge ta-lib
```
then you can use one of the installation methods that mentioned earlier to install pycoin.
for example:
```bash
!pip install "pythoncoin[plot]"
```
finally you can verify installation by running:
```python
import pycoin
```
restart the runtime if colab asked for it.
## Quick start
after installation you can run below code to download market historical data:
```python
from pycoin.data_gathering import KlineData_Fetcher
import datetime as dt
df = KlineData_Fetcher(symbol="BTC/USDT",
timeframe="4h",
data_exchange="binance",
since = dt.datetime(2020, 1, 1)
)
```
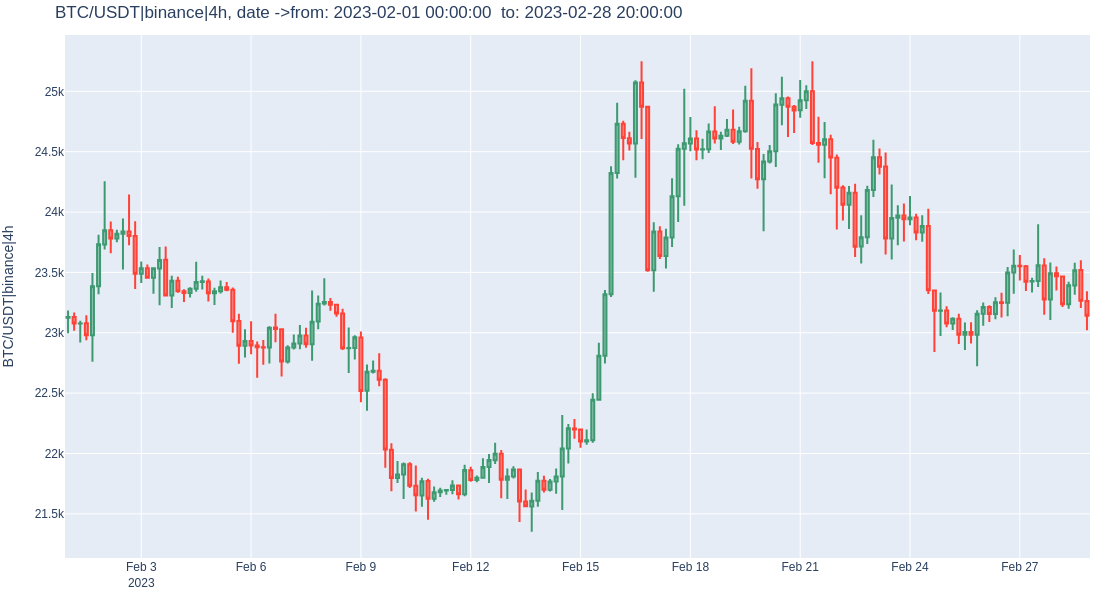
### ploting the candlestick data
```python
from pycoin.plotting import Market_Plotter
plots = Market_Plotter(OHLCV_df=df)
# if plot_by_grp is False then it will plot the whole candlestick data
figure = plots.plot_market()
# if plot_by_grp is True you can plot candlestick data by group and plot a specific year, month,etc.
figure = plots.plot_market(plot_by_grp=True, grp={"year":2023, "month":2})
figure.show()
```
### evaluating market high & lows
```python
from pycoin.data_gathering import get_market_High_Lows
df = get_market_High_Lows(df, candle_range = 100)
df
```
**candle_range** : range of candles to look for high and lows

### ploting market high and lows
```python
plots.plot_high_lows(df, R = 800, y_scale= 0.5)
```
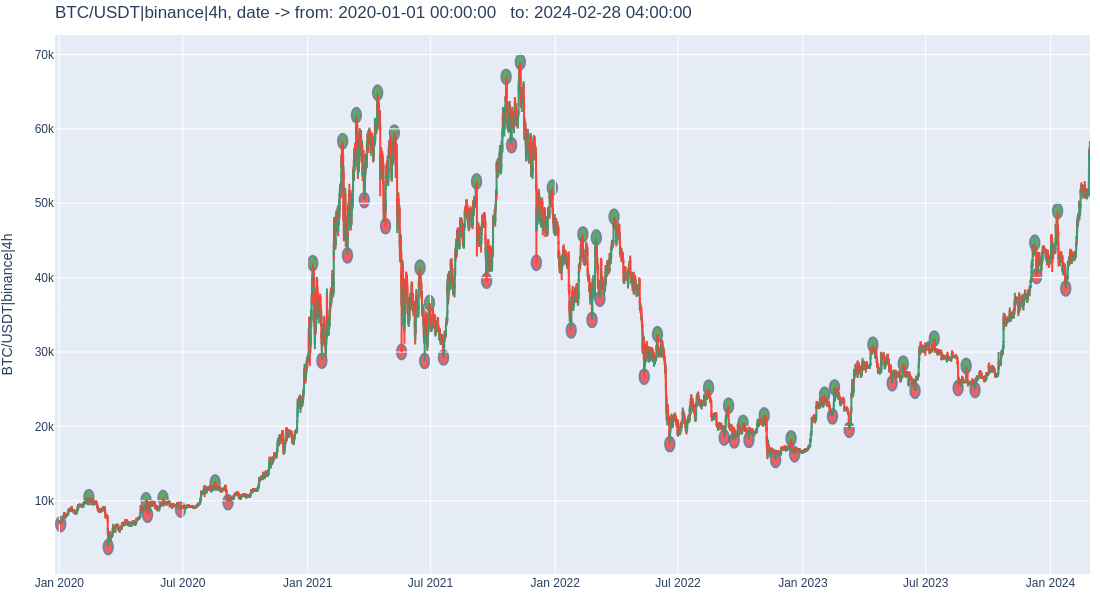
the method above puts a circle for each high and low.
R is the radius and y_scale can scale the price in y axis for better visualizing.
### evaluate market trend with high and lows
every trend that is found with any method such as high & lows, SMA,etc. adds a new column that holds the trend label for each row of data, and when you want to plot these trend you should give this column name to draw_trend_highlight method.
```python
# finding trend
from pycoin.data_gathering import Trend_Evaluator
df = Trend_Evaluator.eval_trend_with_high_lows(df, HighLow_range=100)
# ploting trend
plots.draw_trend_highlight("high_low_trend", df,
add_high_lows_shapes = True,
R = 10000, # circle size of high and lows
y_scale = 0.1 # scales y dim of circles
)
```

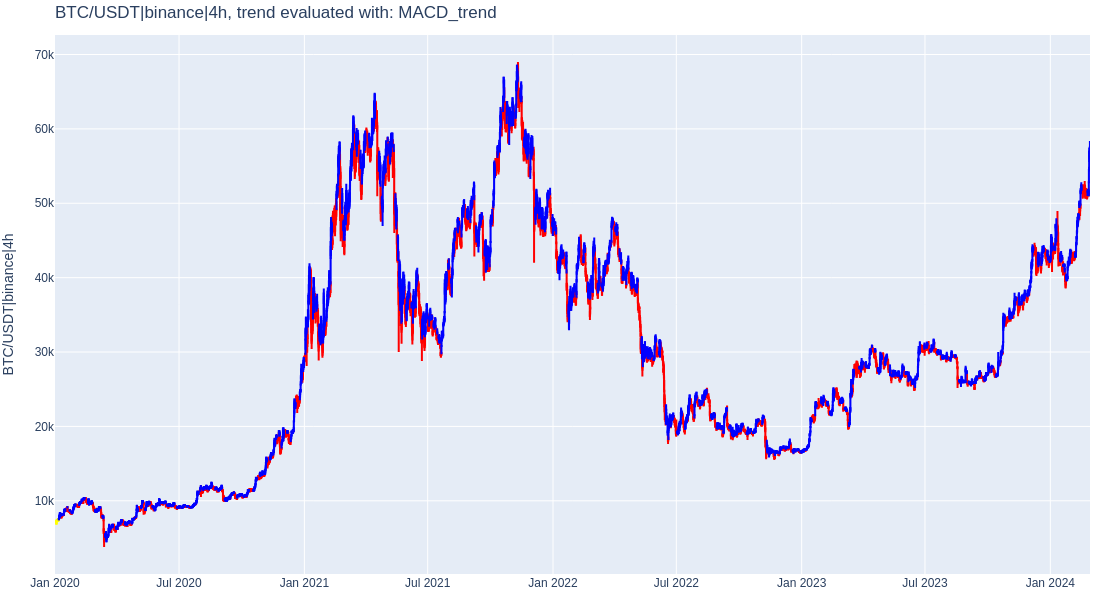
### evaluate trend using MACD + Signal
```python
df = Trend_Evaluator.eval_trend_with_MACD(df, drop_MACD_col = True)
plots.draw_trend_highlight("MACD_trend", df)
```