https://github.com/hageldave/jplotter
OpenGL based 2D Plotting Library for Java using AWT and LWJGL
https://github.com/hageldave/jplotter
awt-gui bezier contour coordinatesystem graphics java opengl opengl3 plot plots quiver scatter svg visualization
Last synced: about 1 year ago
JSON representation
OpenGL based 2D Plotting Library for Java using AWT and LWJGL
- Host: GitHub
- URL: https://github.com/hageldave/jplotter
- Owner: hageldave
- License: mit
- Created: 2019-05-03T00:49:30.000Z (about 7 years ago)
- Default Branch: master
- Last Pushed: 2024-10-18T23:49:08.000Z (over 1 year ago)
- Last Synced: 2025-03-31T19:44:10.517Z (over 1 year ago)
- Topics: awt-gui, bezier, contour, coordinatesystem, graphics, java, opengl, opengl3, plot, plots, quiver, scatter, svg, visualization
- Language: Java
- Homepage: https://github.com/hageldave/JPlotter/wiki
- Size: 4.52 MB
- Stars: 46
- Watchers: 2
- Forks: 6
- Open Issues: 8
-
Metadata Files:
- Readme: README.md
- License: LICENSE
Awesome Lists containing this project
README
# JPlotter
OpenGL based 2D Plotting Library for Java using AWT/Swing and [LWJGL](https://github.com/LWJGL/lwjgl3) through [lwjgl3-awt](https://github.com/LWJGLX/lwjgl3-awt).
An AWT [Graphics2D](https://docs.oracle.com/en/java/javase/11/docs/api/java.desktop/java/awt/Graphics2D.html) fallback solution was introduced to support systems lacking OpenGL-3.3 as well as MacOS.
[](https://github.com/hageldave/JPlotter/actions/workflows/maven.yml)
[](https://search.maven.org/search?q=g:com.github.hageldave.jplotter)
JPlotter's concept is pretty straight forward, you get a `JPlotterCanvas` that is backed by OpenGL (or not in case of fallback).
What is displayed by this canvas depends on the set `Renderer`.
Most likely you want to set a `CoordSysRenderer` that displays a coordinate system.
Within that coordinate system you may want to display points or lines, which you can do by again using a `Renderer` (or multiple) as content.
A `PointsRenderer` can be used to draw points as in a scatter plot, or a `LinesRenderer` can be used to make a line chart or contour plot.
JPlotter is also capable of exporting plots as Scalable Vector Graphics (SVG) through [Apache Batik](https://xmlgraphics.apache.org/batik/)
as well as exporting to portable document format (PDF) through [Apache PDFBox](https://pdfbox.apache.org/).
More details and information can be found in the **[Wiki](https://github.com/hageldave/JPlotter/wiki)**.
## Maven
JPlotter is available as Maven artifact at the Central Maven Repository.
```xml
com.github.hageldave.jplotter
jplotter
1.0.4
```
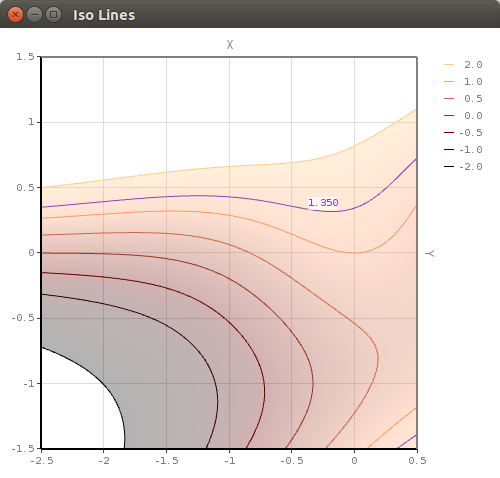
## Teaser Image
See the **[Gallery](https://github.com/hageldave/JPlotter/wiki/Gallery)** for more images.
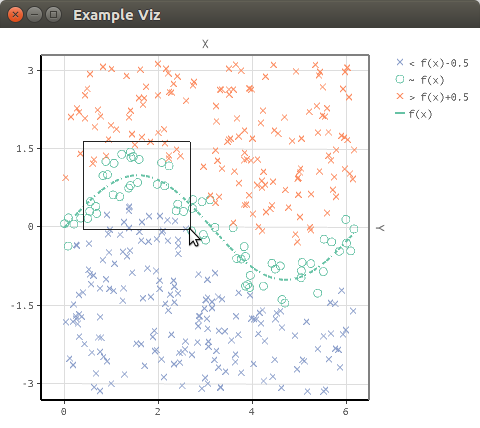
## Code Example
Before visualizing anything, some data has to be generated first.
Lets sample the sine function so we can later plot a line.
```java
DoubleUnaryOperator fx = Math::sin;
int numCurveSamples = 100;
double[] curveX = new double[numCurveSamples];
double[] curveY = new double[numCurveSamples];
for(int i=0; i segment.setColor(sineColor));
Points pointsC1 = new Points(DefaultGlyph.CROSS);
Points pointsC2 = new Points(DefaultGlyph.CIRCLE);
Points pointsC3 = new Points(DefaultGlyph.CROSS);
int c1Color = 0xff8da0cb, c2Color = sineColor, c3Color = 0xfffc8d62;
for(int i=0; i 0.5) {
pointsC3.addPoint(pointsX[i], pointsY[i]).setColor(c3Color);
} else {
pointsC2.addPoint(pointsX[i], pointsY[i]).setColor(c2Color);
}
}
```
Alright next we put everything into a coordinate system.
```java
CoordSysRenderer coordsys = new CoordSysRenderer();
CompleteRenderer content = new CompleteRenderer();
coordsys.setContent( content
.addItemToRender(sineLine)
.addItemToRender(pointsC1)
.addItemToRender(pointsC2)
.addItemToRender(pointsC3));
// lets set the coordinate view to cover the whole sampling space
coordsys.setCoordinateView(-.5, -3.3, 6.5, 3.3);
```
We can also add a legend to the plot so that a viewer can make more sense of the viz.
```java
Legend legend = new Legend();
coordsys.setLegendRightWidth(80);
coordsys.setLegendRight(legend
.addLineLabel(2, sineColor, "f(x)")
.addGlyphLabel(DefaultGlyph.CROSS, c1Color, "< f(x)-0.5")
.addGlyphLabel(DefaultGlyph.CIRCLE, c2Color, "~ f(x)")
.addGlyphLabel(DefaultGlyph.CROSS, c3Color, "> f(x)+0.5"));
```
We will use a blank canvas to display our coordinate system.
For exploring the plot we can add some controls for zooming.
```java
boolean useOpenGL = true;
JPlotterCanvas canvas = useOpenGL ? new BlankCanvas() : new BlankCanvasFallback();
canvas.setRenderer(coordsys);
// lets add some controls for exploring the data
new CoordSysScrollZoom(canvas,coordsys).setZoomFactor(1.7).register();
new CoordSysViewSelector(canvas,coordsys) {
{extModifierMask=0;/* no need for shift to be pressed */}
public void areaSelected(double minX, double minY, double maxX, double maxY) {
coordsys.setCoordinateView(minX, minY, maxX, maxY);
}
}.register();
```
Nice, now we conclude with some typical AWT/Swing code to launch the viz in a JFrame.
```java
JFrame frame = new JFrame("Example Viz");
frame.setDefaultCloseOperation(JFrame.EXIT_ON_CLOSE);
frame.getContentPane().add(canvas.asComponent());
canvas.asComponent().setPreferredSize(new Dimension(480, 400));
canvas.asComponent().setBackground(Color.white);
// register a listener that will cleanup GL resources on window closing
canvas.addCleanupOnWindowClosingListener(frame);
SwingUtilities.invokeLater(()->{
frame.pack();
frame.setVisible(true);
});
```
We can also add a pop up menu for exporting to SVG, PDF or PNG.
```java
PopupMenu menu = new PopupMenu();
canvas.asComponent().add(menu);
canvas.asComponent().addMouseListener(new MouseAdapter() {
public void mouseClicked(MouseEvent e) {
if(SwingUtilities.isRightMouseButton(e))
menu.show(canvas.asComponent(), e.getX(), e.getY());
}
});
// Exporting SVG
MenuItem svgExport = new MenuItem("SVG export");
svgExport.addActionListener(e->{
Document svg = SVGUtils.containerToSVG(frame.getContentPane());
SVGUtils.documentToXMLFile(svg, new File("example_export.svg"));
System.out.println("exported SVG.");
});
menu.add(svgExport);
// Exporting PDF
MenuItem pdfExport = new MenuItem("PDF export");
pdfExport.addActionListener(e->{
PDDocument doc = PDFUtils.containerToPDF(frame.getContentPane());
doc.save("example_export.pdf");
doc.close();
});
menu.add(pdfExport);
// Exporting PNG
MenuItem pngExport = new MenuItem("PNG export");
pngExport.addActionListener(e->{
Img img = new Img(frame.getContentPane().getSize());
img.paint(g -> frame.getContentPane().paintAll(g));
ImageSaver.saveImage(img.getRemoteBufferedImage(), "example_export.png");
System.out.println("exported PNG.");
});
menu.add(pngExport);
```
*[```Source```](https://github.com/hageldave/JPlotter/blob/master/jplotter/src/test/java/hageldave/jplotter/Example.java)*