https://github.com/hasura/graphql2chartjs
graphql2chartjs reshapes your GraphQL data as per the ChartJS API.
https://github.com/hasura/graphql2chartjs
Last synced: 3 months ago
JSON representation
graphql2chartjs reshapes your GraphQL data as per the ChartJS API.
- Host: GitHub
- URL: https://github.com/hasura/graphql2chartjs
- Owner: hasura
- License: mit
- Created: 2019-10-16T08:50:18.000Z (over 6 years ago)
- Default Branch: master
- Last Pushed: 2023-07-11T21:56:02.000Z (almost 3 years ago)
- Last Synced: 2025-07-19T16:07:39.296Z (11 months ago)
- Language: JavaScript
- Size: 1.07 MB
- Stars: 227
- Watchers: 7
- Forks: 24
- Open Issues: 41
-
Metadata Files:
- Readme: README.md
- License: LICENSE
Awesome Lists containing this project
- awesome-starred - hasura/graphql2chartjs - graphql2chartjs reshapes your GraphQL data as per the ChartJS API. (others)
README
# graphql2chartjs - Instant realtime charts using GraphQL
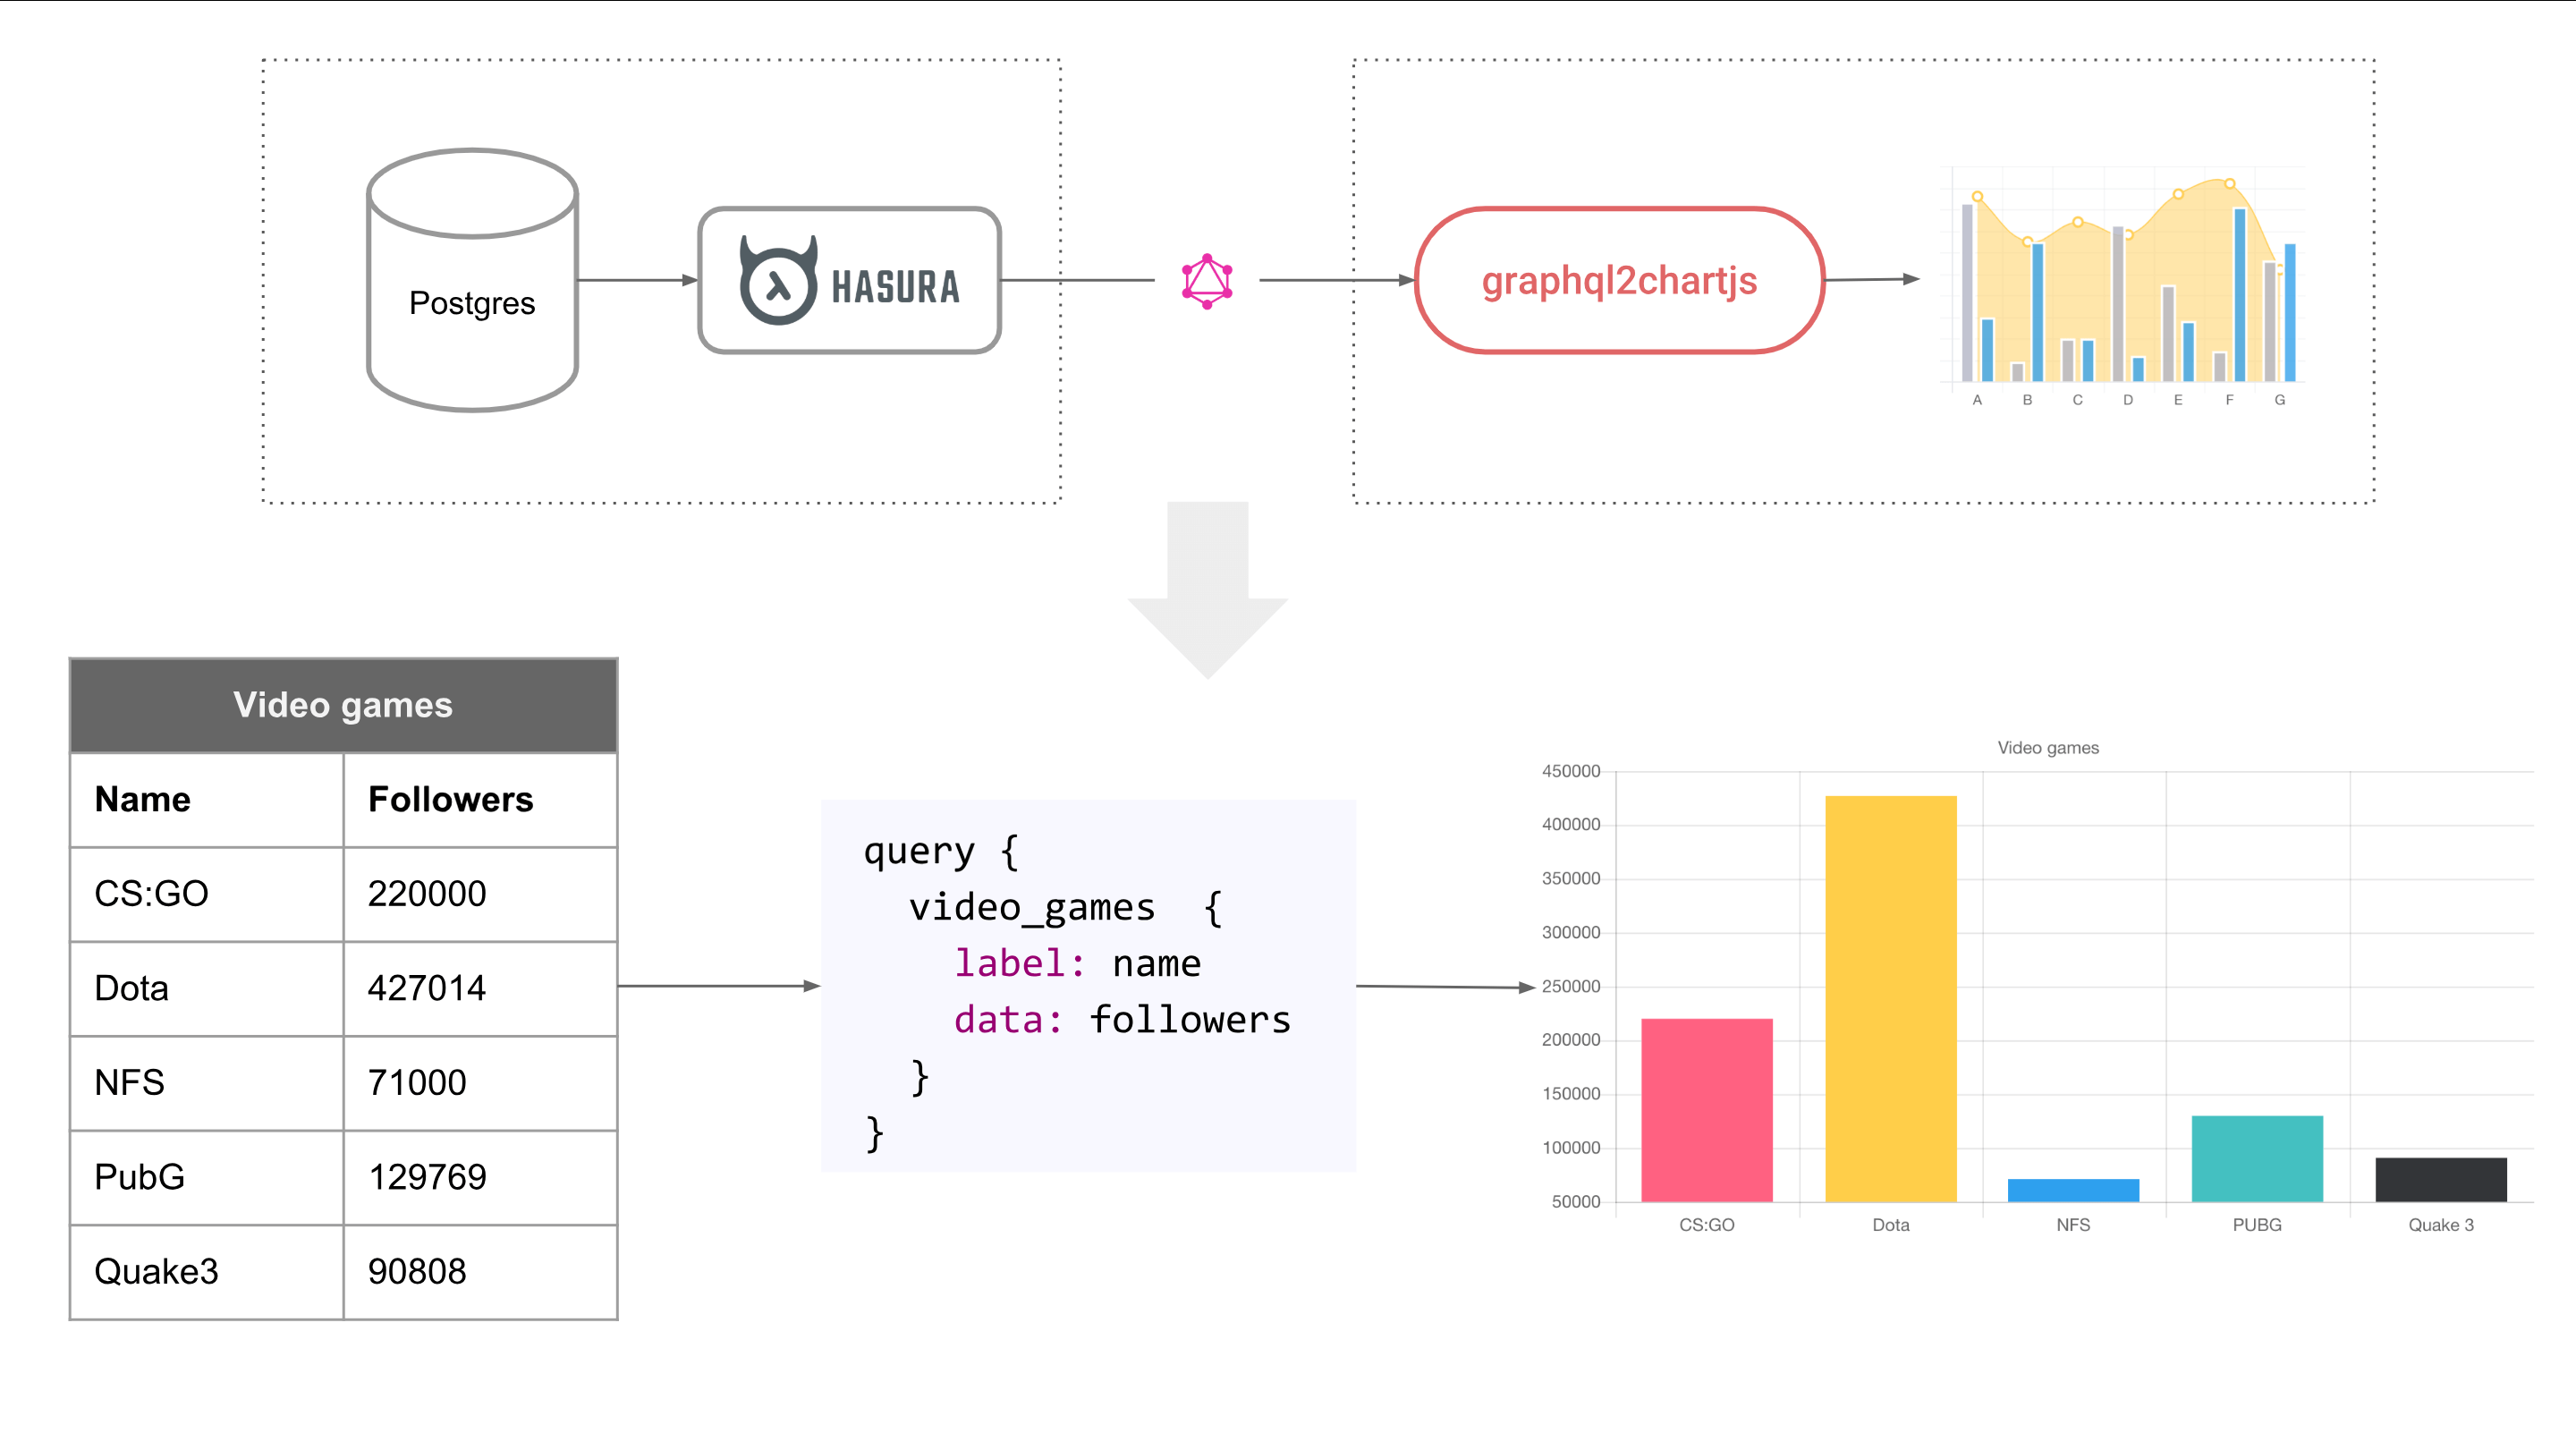
`graphql2chartjs` reshapes your GraphQL data as per the [ChartJS](https://chartjs.org) API. This makes it easy to query a GraphQL API and render the output as a ChartJS chart.
For example, if you're using Postgres and [Hasura](https://hasura.io), this is what using `graphql2chartjs` looks like:
## Demos & sandbox
We've set up a GraphQL server with continuously changing data, so that you can try graphql2chartjs out easily.
|[View live charts](https://graphql2chartjs-examples.herokuapp.com) | [Edit in sandbox](https://codesandbox.io/s/p2wpj1o8pj) | [Open GraphiQL](https://g2c-examples-graphiql.herokuapp.com/) |
|---|---|---|
The demo above cover the following types of charts: [basic](https://graphql2chartjs-examples.herokuapp.com/#bar), [multiple datasets](https://graphql2chartjs-examples.herokuapp.com/#multi-bar), [mixed chart-types](https://graphql2chartjs-examples.herokuapp.com/#mixed), [realtime chart with live data](https://graphql2chartjs-examples.herokuapp.com/#live-chart), [realtime time-series](https://graphql2chartjs-examples.herokuapp.com/#timeseries-chart)
## Usage with Hasura
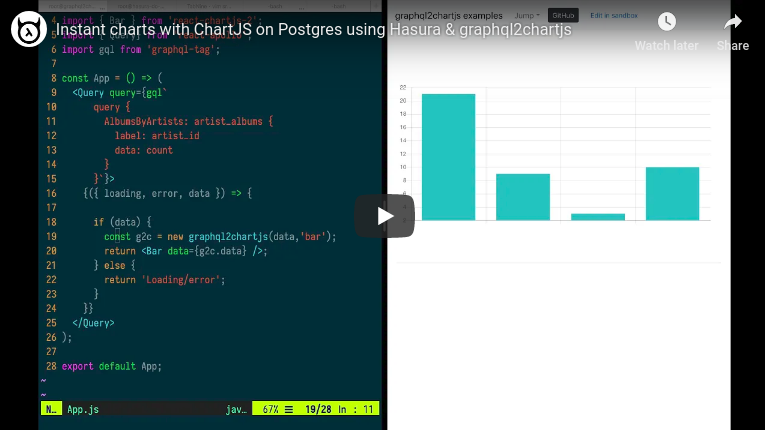
Hasura gives you an instant realtime GraphQL API on an existing Postgres database. You can create views to capture analytics and aggregations on your database and instantly turn them into charts.
Watch this video below to see a demo/tutorial of using Hasura with an existing Postgres database, creating views and building charts.
## Example usage with react, apollo and react-chartjs-2
```javascript
import {Query} from 'react-apollo';
import gql from 'graphql-tag';
import graphql2chartjs from 'graphql2chartjs';
import {Bar} from 'react-chartjs-2';
const Chart = () => (
{({data} => {
if (data) {
const g2c = new graphql2chartjs(data, 'bar');
return ();
}
return null;
}
);
```
## Mapping GraphQL queries to ChartJS charts
Different types of charts need different structures in their datasets.
For example a bar chart dataset needs labels and data associated for each label; the ChartJS API refers to this as `label` and `data`. Once you alias fields in your graphql query to `label` and `data`, and pass the response through `graphql2chartjs`, your dataset is ready to be used by bar chart in chartjs.
### Bar / Line / Doughnut / Pie / Radar / Polar Area / Area
Charts of this type need 2 data inputs, `label` and `data`.
```graphql
query {
ArticleLikes : articles {
label: title
data: likes
}
}
```
### Scatter / Bubble
Charts of this type need 2 data inputs: `data_x`, `data_y` (and `data_r` for bubble).
```graphql
query {
ArticleLikesVsComments : articles {
data_x: num_likes
data_y: num_comments
}
}
```
### Time series (line / bar)
Charts of this type need 2 data inputs, `data_x` or `data_t` and `data_y`. Note that there is no `label`.
```graphql
query {
StockPrices : stockprice {
data_t: created
data_y: price
}
}
```
## graphql2chartjs usage
graphql2chartjs works in 3 steps:
1. Initialise graphql2chartjs: `const g2c = new graphql2chartjs()`
2. Add data from your graphql response: `g2c.add(graphqlResponse.data, 'line')`
3. Set your chart data to the data properly of the graphql2chartjs instance: `g2c.data`
### Step 1: Initialiase with data: `new graphql2chartjs()`
#### Option 1: Initialise with data and chart type
**`graphql2chartjs(data, chartType)`**
```javascript
const g2c = new graphql2chartjs(data, 'bar');
```
- `data`: This is your GraphQL response. This data should have fields `label`, `data` etc. as per the GraphQL querying described above.
- `chartType`: This is a string that represents valid values of what your chart type is. Valid values include `'line'`, `'bar'`, `'radar'`, `'doughnut'`, `'pie'`, `'polarArea'`, `'bubble'`, `'scatter'`.
**Notes:**
- This is the simplest way of using `graphql2chartjs`
- If you have multiple datasets, all of the datasets will be rendered automatically as the same type of chart
- To customise the UI options of the rendered chart like colors or to create a mixed type chart (one dataset is rendered as a line chart, another as a bar chart) use the next initialisation method instead of this one.
#### Option 2: Initialise with data and a transform function
**`graphql2chartjs(data, transform)`**
The transformation function can add chartjs dataset props or even modify the record data:
```javascript
const g2c = new graphql2chartjs(data, (datasetName, dataPoint) => {
return {
chartType: 'bar',
backgroundColor: 'yellow'
};
});
```
- `transform(datasetName, dataPoint)`: This function defined by you can take the name of the dataset and the data record that comes from the GraphQL response and returns an object that can should have the `chartType` key and optionally other keys that specify other dataset properties.
- The object returned by this function should look like the following:
```javascript
{
chartType: 'line', // Or 'line', 'bar', 'radar', 'doughnut', 'pie', 'polarArea', 'bubble', 'scatter'
}
```
- `chartType`: This should be a string value, one of: `'line'`, `'bar'`, `'radar'`, `'doughnut'`, `'pie'`, `'polarArea'`, `'bubble'`, `'scatter'`
- Other keys in this object should be dataset properties. These properties are slightly different for different chart types.
- Line chart: https://www.chartjs.org/docs/latest/charts/line.html#dataset-properties
- Bar chart: https://www.chartjs.org/docs/latest/charts/bar.html#dataset-properties
- Radar chart: https://www.chartjs.org/docs/latest/charts/radar.html#dataset-properties
- Doughnut & Pie: https://www.chartjs.org/docs/latest/charts/doughnut.html#dataset-properties
- Polar: https://www.chartjs.org/docs/latest/charts/polar.html#dataset-properties
- Bubble: https://www.chartjs.org/docs/latest/charts/bubble.html#dataset-properties
- Scatter: https://www.chartjs.org/docs/latest/charts/scatter.html#dataset-properties
### Step 2: Now create your chart with data - `g2c.data`
`g2c.data` gives you access to the latest ChartJS data that can be passed to your chart.
1. Javascript
```javascript
var myChart = new Chart(ctx, { data: g2c.data });
```
2. react-chartjs-2
```javascript
```
### Step 3: (optional) Incrementally add data for your chart
**`g2c.add()`**
Once you've initialised a `graphql2chartjs` object, you can use the `add` function to add data for the first time or incrementally:
```javascript
await data = runQuery(..);
// Add for a chart type
g2c.add(data, 'line');
// Add with a transformation function to change UI props for the new data added or udpated
g2c.add(data, (datasetName, dataPoint) => {
chartType: 'line',
pointBackgroundColor: 'yellow'
});
```
## Installation
### Via npm
```
npm install --save graphql2chartjs
```
### Use in a script tag
```html
```
## Reforming the data
### `reform()`
You can reform the existing data in your `graphql2chartjs` instance using the reform function that takes a reformer function as an argument. This reformer function is run over every datapoint in every dataset. For instance, to scale the x and y coordinates, you would do something like:
```
g2c.reform((datasetName, dataPoint) => {
// scale the x, y coordinates
return {
data_x: scalingFactor(dataPoint.data_x),
data_y: scalingFactor(dataPoint.data_y)
}
})
```