https://github.com/hawkular/hawkular-grafana-datasource
Hawkular Datasource for Grafana
https://github.com/hawkular/hawkular-grafana-datasource
Last synced: over 1 year ago
JSON representation
Hawkular Datasource for Grafana
- Host: GitHub
- URL: https://github.com/hawkular/hawkular-grafana-datasource
- Owner: hawkular
- License: apache-2.0
- Created: 2016-05-31T14:49:48.000Z (about 10 years ago)
- Default Branch: master
- Last Pushed: 2019-03-11T19:52:23.000Z (over 7 years ago)
- Last Synced: 2025-03-25T10:12:06.758Z (over 1 year ago)
- Language: JavaScript
- Size: 1000 KB
- Stars: 22
- Watchers: 10
- Forks: 35
- Open Issues: 6
-
Metadata Files:
- Readme: README.md
- License: LICENSE
Awesome Lists containing this project
README
# Hawkular Datasource for Grafana
This project is the Hawkular Datasource plugin for Grafana. It works with:
* Hawkular Metrics (standalone)
* Hawkular Services, starting from version Alpha13
* OpenShift with Hawkular Metrics
## Configuration
The datasource URL must point to the Hawkular server, e.g. `http://myhost:8080/hawkular` (without ending `/metrics`)
Access: both `proxy` and `direct` modes should work in most configurations. Some earlier versions of Hawkular Metrics had a bug with CORS headers, that prevented the use of `direct` mode here.
If you want to use `direct` mode (that is, direct calls from client browser to Hawkular REST API), and if you have setup CORS restrictions in Hawkular, make sure to allow the Grafana server origin in Metrics' configuration.
If you're unsure, just use `proxy` mode and you should be fine.
Authentication must be set when working with a Hawkular server. Check the 'Basic Auth' box and fill the user and password fields.
Select the tenant. On Hawkular servers, use `hawkular`.
Alternatively, you can select _Tenant per query_, in which case the tenant will be prompted for every queries while editing a chart in dashboards.
Openshift-Metrics users must provide an authentication token.
Note that if you configure both Basic Authentication and a Token, only Basic Authentication will be effective.
## Usage
### Queries
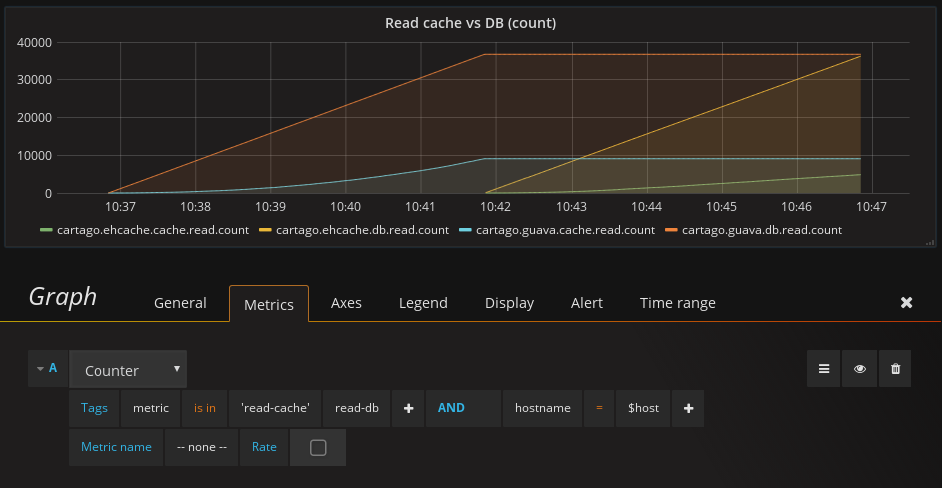
When adding a Graph panel, the Metrics tab allows you fetch _Gauges_, _Counters_ and _Availability_ metrics in Hawkular. You can search by metric name and/or tag, assuming your version of hawkular-metrics is at least 0.20.0. Prior versions only allow searching by name.
> To know your version of hawkular-metrics, check the _status_ endpoint. E.g. `http://myhost:8080/hawkular/metrics/status`
Since 0.24.0, hawkular-metrics offers a _"tags query language"_ that allows more accurate queries on tags. If you query with tags and leave the metric name empty, the graph will display all matching metrics:
Tags queries are also useful to refine the metric name suggestions (auto-completion), to facilitate usage when Hawkular contains a lot of metrics:
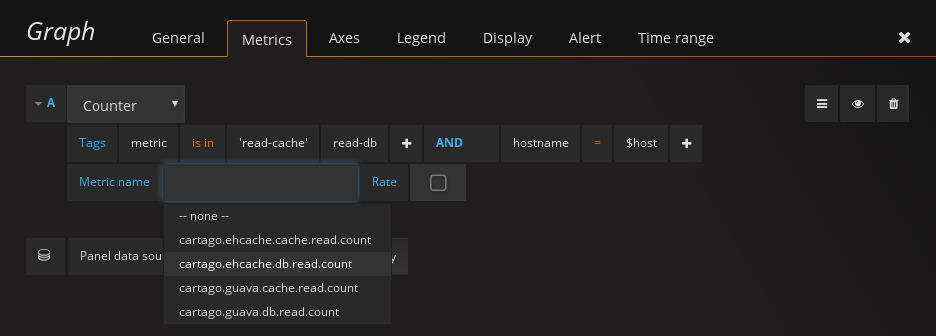
To remove a tag expression, click on the tag name and select "Remove tag".
A full text editor is available, to use Hawkular's tag query language:
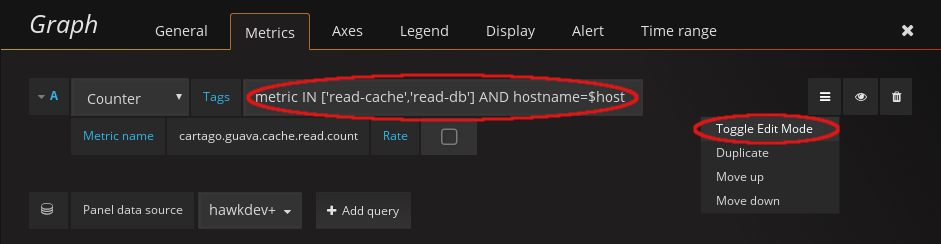
> When used with hawkular-metrics prior to 0.24.0, tags are still available but the UI switches to the old key-value pairs system.
When using a _Singlestat_ panel, some additional options come in. The Hawkular Datasource plugin can perform aggregations on multiple metrics, which usually the _Singlestat_ panel doesn't. It's actually a two-steps aggregation: first, multiple series are reduced into a single one (that is either the sum of its parts, or the average). Then, the resulting series is aggregated over time through another folding: min, max, average etc.
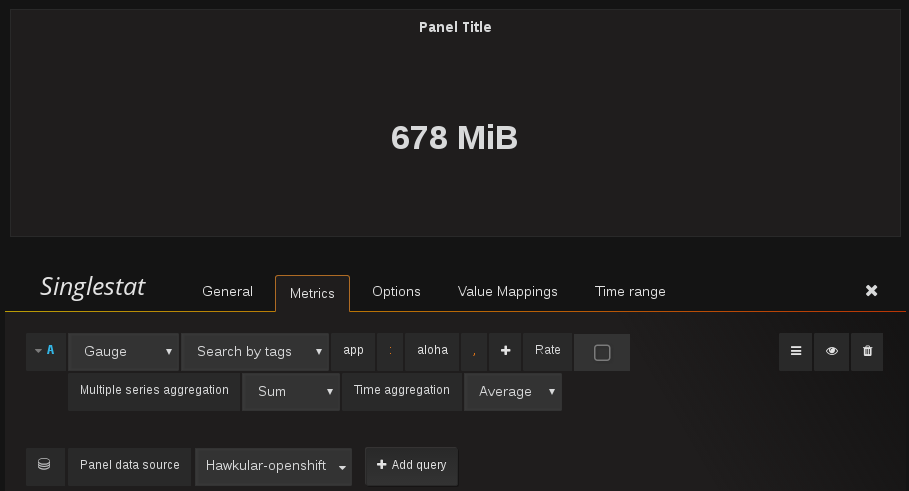
> Note that because the aggregation takes place in Hawkular, the _Singlestat_ panel has nothing to aggregate. Thus in panel options, setting whatever in the _value_ field on the _Big value_ won't have any effect. However if you don't want to use the Hawkular aggregation, just set _Multiple series aggregation_ to _None_.
### Tenant per query
If you selected the _Tenant per query_ option in the Datasource configuration, you will have to provide the tenant name for every queries. You can enter either a full-text name in the _Tenant_ field, or a variable that can holds several tenant names: just enter the variable name prefixed with `$`. (See section _Templating variables_ for more information on variables). Note that, due to limitations with the templating variables, the list of tenants cannot be fetched dynamically from a remote source. It has to be defined explicitly, for instance, as a list of values with variables of type _Custom_.
### Templating variables
Grafana allows you to create dashboard templates through the definition of variables.
This is [documented on Grafana's site](http://docs.grafana.org/reference/templating/).
With the Hawkular Datasource Plugin, the variables of type _'Query'_ are mapped to
the [_@get (url)/metrics_](http://www.hawkular.org/docs/rest/rest-metrics.html#GET__metrics)
Hawkular Metrics endpoint and can be used to retrieve tenant's metric names. Use the _Query Options_ text field to pass query parameters, as illustrated below:
Example of query by tags to get metric ids
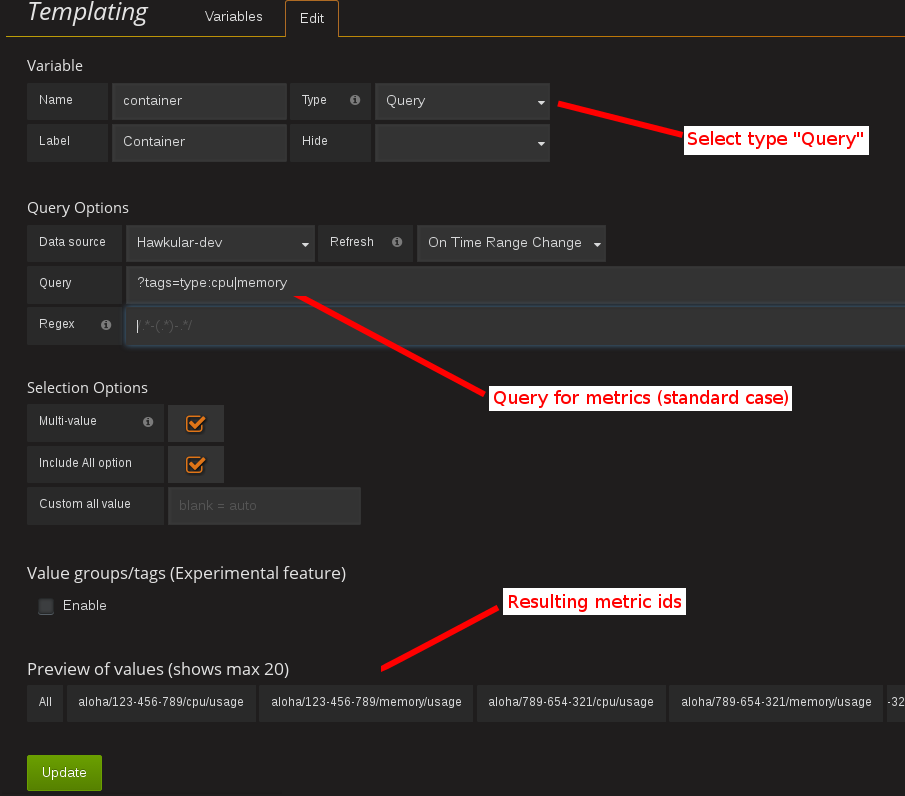
> For instance, if you have metrics tagged _"type:memory"_ and others tagged _"type:cpu"_, you can write _"tags=type:memory"_ to get only the _"memory"_ ones, or _"tags=type:cpu|memory"_ to get them both.
There is an exception to that rule: if the query string is prefixed with _'tags/'_, the variable will contain the matching
tag names rather than the metric names. In this case, the Hawkular Metrics endpoint [_@get (url)/metrics/tags/{tags}_](http://www.hawkular.org/docs/rest/rest-metrics.html#GET__metrics_tags__tags) will be used.
Example of query to get matching tag values
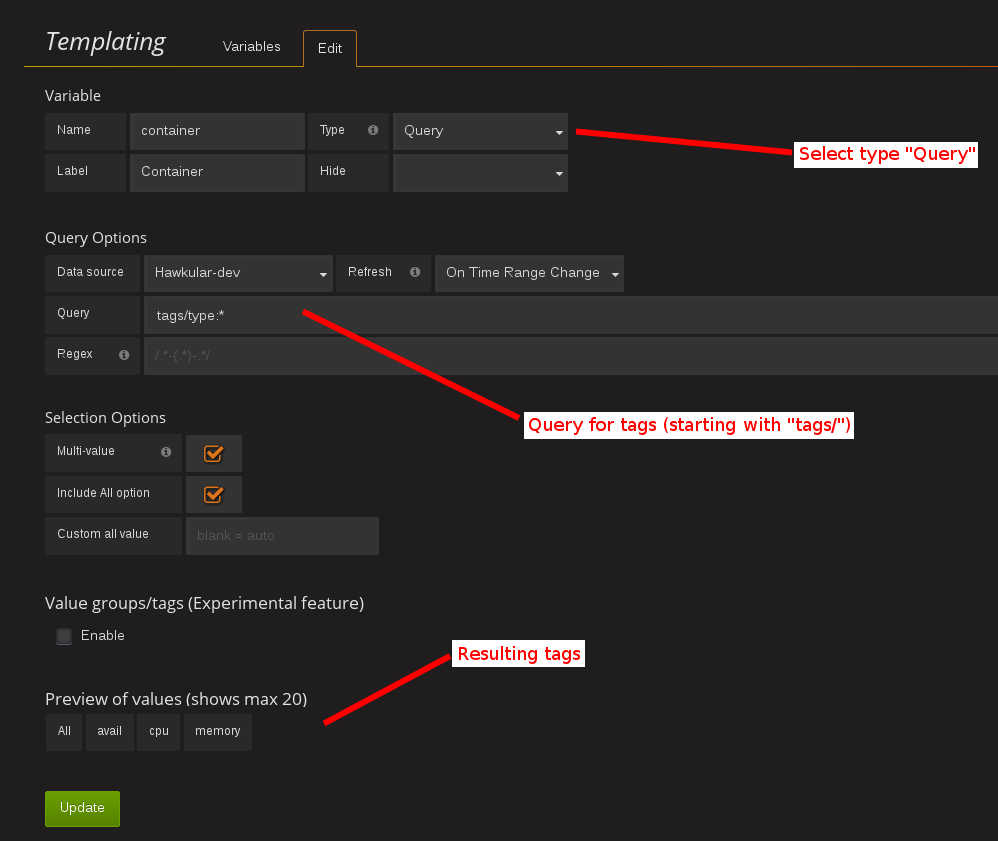
> For instance, type _"tags/type:*"_ to get all of the available tag values for _"type"_.
Once you have set some variables, you can use them in graph queries by inserting the variable name prefixed with a _$_. It can be used either for row or graph duplication, or to display multiple series in a single graph from a single query. This is especially useful when metric names contain some dynamic parts and thus cannot be known in advance.
They can also be used in tag values, after operators _=_ / _!=_ / _is in_ / _is not in_.
### Annotations
Annotations are available through the use of _'string'_ and _'availability'_ metrics in Hawkular, or _'events'_ from Hawkular Alerts. It's a Grafana feature that allows to display custom events in timed charts.
Example with a _'string'_ metric:
1. Setup an annotation query in Grafana. In _'Query'_, put the name of a _'string'_ metric you want to use to gather these annotations.
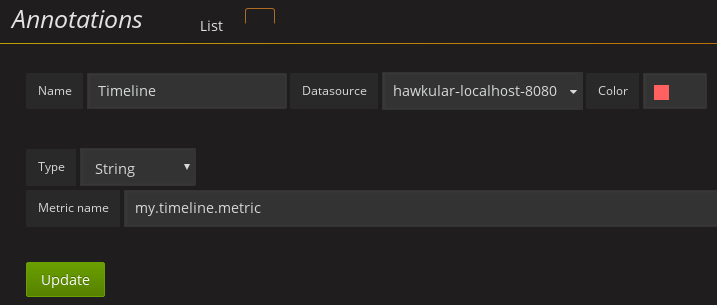
2. Post any event (ie. string + timestamp) to some string metric.
Example, JSON posted on [the Hawkular's REST API](http://www.hawkular.org/hawkular-metrics/docs/user-guide/#_inserting_data) to `/strings/my.timeline.metric/raw`:
```json
[
{"timestamp": 1485352477824, "value": "Starting my scenario..."}
]
```
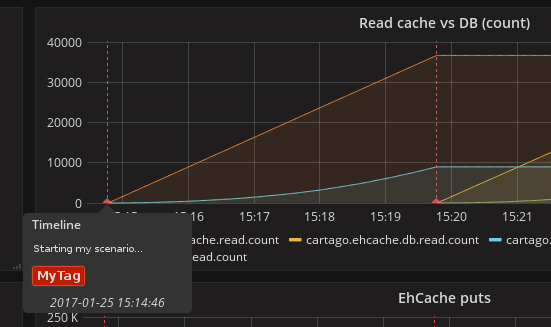
3. Check your charts:
In the case of Hawkular Alerts events, you need to provide the trigger ID (several comma-separated IDs are allowed).
### Legend
Metric names can be customized in chart legend. The `Legend` field can receive regular expressions in that purpose. Regex must be written between double curly braces, and include a parentheses group to point to what must be written: `{{(.*)}}`
_Example:_
> From metric name `pod/c6e2a9ab-8d1c-11e7-b7be-06415eb17bbf/custom/haproxy_server_bytes_in_total{namespace=my-namespace,pod=web-45-6f464,route=web,server=10.1.10.138:8080,service=web}`
>
> Legend: `HAProxy Server Bytes In {{namespace=([^,}]+)}} / {{pod=([^,}]+)}}`
>
> Result: `HAProxy Server Bytes In my-namespace / web-45-6f464`
## Installing from sources
Additional information on installing from sources can be found on [hawkular.org](http://www.hawkular.org/hawkular-clients/grafana/docs/quickstart-guide/).
## Troubleshooting
### Grafana fails to establish a connection or get data from hawkular
* Check the URL: `[host]/hawkular`. Make sure there's no ending slash. When you open up this URL in a browser you should see the Hawkular logo, the installed version and a mention that the service is started.
* Make sure the credentials or token match your installation. In general, if you installed a **standalone hawkular-metrics** server without any specific configuration you probably don't have any authentication information to provide. If you installed **hawkular-services** using its [installation guide](http://www.hawkular.org/hawkular-services/docs/installation-guide/) you will probably have to fill-in the basic auth fields. If you are using **Hawkular from OpenShift**, you have to provide a Bearer token in the `Token` field. Tokens can be [generated temporarily](https://docs.openshift.com/enterprise/3.1/architecture/additional_concepts/authentication.html) (go to `[OpenShift host]/oauth/token/request`) or from a [Service account](https://docs.openshift.com/container-platform/3.3/rest_api/index.html#rest-api-serviceaccount-tokens) in OpenShift.
* Check the javascript debugging tool of your browser. If you see an error mentioning issues with CORS, switch to `proxy` mode in the datasource configuration.
### I can't query by tag, the option is not displayed
Querying by tag was introduced before the plugin was properly versioned, so if you have a version >= 1.0.2 you should have it. However it is only enabled when Grafana talks to hawkular-metrics >= 0.20.0. To check your version of hawkular-metrics just open its status page in a browser (`[host]/hawkular/metrics` or `[host]/hawkular/metrics/status`).
### Connection is OK but I can't get any metric
Make sure the tenant you've configured is exactly the same than the one used to insert data. Beware that it is case sensitive. If you have any doubt about the actual presence of data in Hawkular, you can confirm with a `curl` command, for instance:
```bash
curl -u myUsername:myPassword \
-X GET "http://myserver/hawkular/metrics/gauges/mymetric/raw" \
-H "Content-Type: application/json" -H "Hawkular-Tenant: myTenant"`
```
More about the REST API: http://www.hawkular.org/docs/rest/rest-metrics.html
Also note that in Hawkular, data has a retention period of 7 days by default ([it can be configured](http://www.hawkular.org/hawkular-metrics/docs/user-guide/#_data_retention_and_removal)). So if no data has been produced since that time, you won't be able to see anything.
### I'm running Hawkular in OpenShift, connection is OK but I can't get any metric
Check your version of hawkular-metrics (`[host]/hawkular/metrics` or `[host]/hawkular/metrics/status`). Prior to 0.16.0, metric names containing slashes, like in OpenShift, were unfortunately not showing up in Grafana. You can consider [upgrading metrics](https://docs.openshift.org/latest/install_config/upgrading/manual_upgrades.html#manual-upgrading-cluster-metrics).