https://github.com/haydenjames/vps-disk-latency-bench
Latency-focused disk benchmarks for Linux VPS environments.
https://github.com/haydenjames/vps-disk-latency-bench
benchmark fio latency-test linux sysadmin-scripts vps
Last synced: 6 months ago
JSON representation
Latency-focused disk benchmarks for Linux VPS environments.
- Host: GitHub
- URL: https://github.com/haydenjames/vps-disk-latency-bench
- Owner: haydenjames
- License: mit
- Created: 2026-02-03T00:02:18.000Z (6 months ago)
- Default Branch: main
- Last Pushed: 2026-02-03T00:06:13.000Z (6 months ago)
- Last Synced: 2026-02-03T13:30:10.581Z (6 months ago)
- Topics: benchmark, fio, latency-test, linux, sysadmin-scripts, vps
- Language: Shell
- Homepage: https://linuxblog.io/vps-nvme-iops-vs-latency/
- Size: 5.86 KB
- Stars: 1
- Watchers: 0
- Forks: 0
- Open Issues: 0
-
Metadata Files:
- Readme: README.md
- License: LICENSE
Awesome Lists containing this project
README
# VPS Disk Latency Bench (fio)
Latency-focused disk benchmarks for VPS environments.
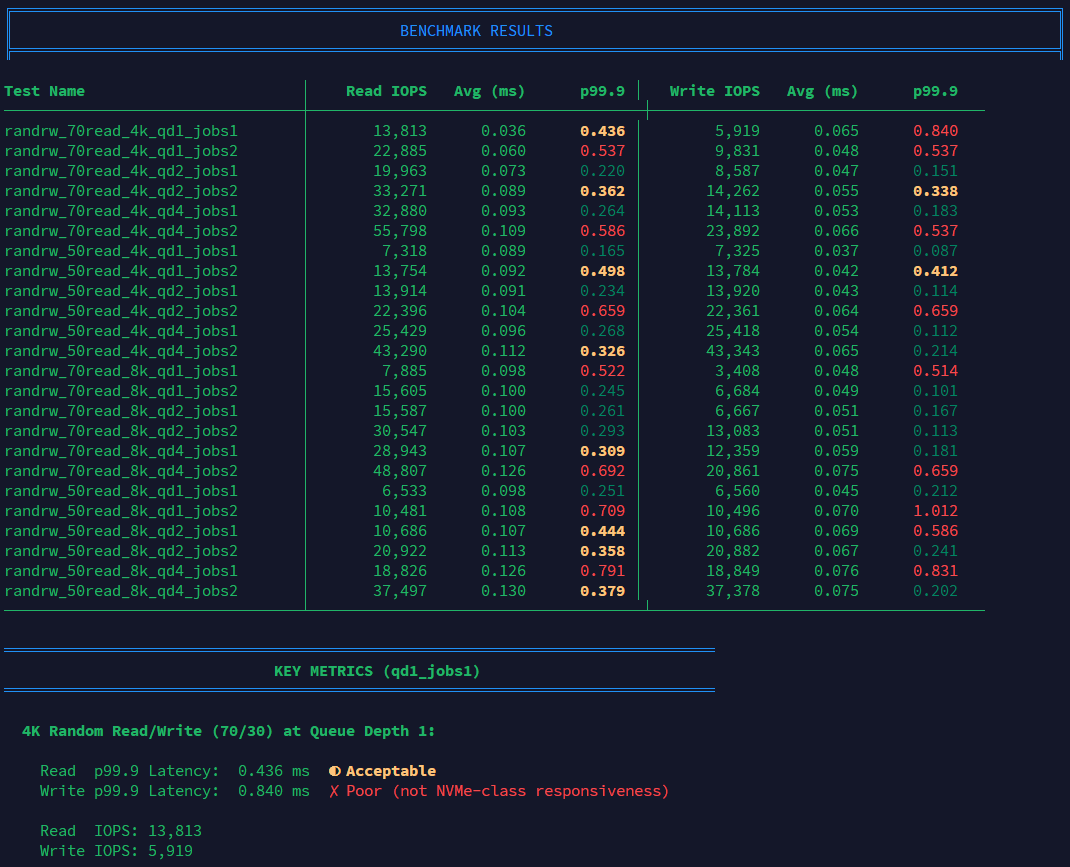
This script runs small-block mixed random I/O at low queue depths and light concurrency, then prints a **formatted results table** with color-coded latency assessments.
## Why latency, not IOPS?
Most VPS workloads (web servers, databases, applications) operate at queue depth 1-2 with single-threaded I/O. High IOPS numbers from synthetic benchmarks at qd32+ don't reflect real-world performance.
**This script tests what actually matters: p99.9 latency at low queue depth.**
Read more: [VPS IOPS vs. Latency: Why NVMe Benchmarks Lie](https://linuxblog.io/disk-io-vs-latency-why-nvme-benchmarks-lie/)
## Features
- **Formatted table output** with aligned columns
- **Color-coded p99.9 latency** (green/yellow/red thresholds)
- **Key metrics summary** highlighting the most important qd1 results
- **Pass/fail assessment** against 0.3ms NVMe threshold
- **Progress indicator** during test execution
- **JSON + TXT output** for both human reading and scripting
## Requirements
Required:
- `fio`
Standard tools (present on most Linux systems):
- `dd`, `awk`, `sed`, `date`, `hostname`
Optional:
- `bc` (used for floating-point comparisons; falls back to awk)
- `tput` (for colorized output, if supported)
- `jq` (only needed if you want to manually inspect the raw JSON output)
## Quick Start
```bash
# Download
curl -O https://raw.githubusercontent.com/haydenjames/VPS-Disk-Latency-Bench/main/bench-io.sh
chmod +x bench-io.sh
# Run with defaults (2GB file, 30s per test)
./bench-io.sh
# Quick test (smaller file, shorter runtime)
FILE_SIZE_GB=1 RUNTIME_SEC=10 ./bench-io.sh
```
## Sample Output
```
╔═══════════════════════════════════════════════════════════════════════════╗
║ VPS Disk Latency Benchmark - Latency-Focused Testing ║
╚═══════════════════════════════════════════════════════════════════════════╝
Test Name │ Read IOPS Avg (ms) p99.9 │ Write IOPS Avg (ms) p99.9
─────────────────────────────────┼─────────────────────────────────────┼─────────────────────────────────────
randrw_70read_4k_qd1_jobs1 │ 9,013 0.089 0.157 │ 3,882 0.036 0.089
randrw_70read_4k_qd1_jobs2 │ 17,238 0.091 0.214 │ 7,397 0.041 0.098
...
═══════════════════════════════════════════════════════════════════════════════
KEY METRICS (qd1_jobs1)
═══════════════════════════════════════════════════════════════════════════════
4K Random Read/Write (70/30) at Queue Depth 1:
Read p99.9 Latency: 0.157 ms ✓ Excellent (NVMe-class)
Write p99.9 Latency: 0.089 ms ✓ Excellent (NVMe-class)
Latency Thresholds:
< 0.3ms = Excellent (true NVMe-class performance)
< 0.5ms = Acceptable
>= 0.5ms = Poor (likely throttled, shared, or not true NVMe)
```
## Configuration
Override defaults via environment variables:
| Variable | Default | Description |
|----------|---------|-------------|
| `FILE_DIR` | `/var/tmp` | Directory for test file |
| `FILE_SIZE_GB` | `2` | Test file size in GiB |
| `RUNTIME_SEC` | `30` | Runtime per test in seconds |
| `WARMUP_SEC` | `5` | Warmup time before each test |
| `IODEPTHS` | `1 2 4` | Queue depths to test |
| `BS_LIST` | `4k 8k` | Block sizes to test |
| `MIX_LIST` | `70 50` | Read percentages (70 = 70% read, 30% write) |
| `JOBS_LIST` | `1 2` | Number of parallel jobs |
| `ENGINE` | `libaio` | fio I/O engine |
| `OUTPUT_DIR` | `./bench_out` | Output directory |
### Examples
```bash
# Minimal test (fastest)
FILE_SIZE_GB=1 RUNTIME_SEC=5 IODEPTHS="1" BS_LIST="4k" MIX_LIST="70" JOBS_LIST="1" ./bench-io.sh
# Full test with larger file
FILE_SIZE_GB=4 RUNTIME_SEC=60 ./bench-io.sh
# Custom output directory
OUTPUT_DIR=/tmp/benchmarks ./bench-io.sh
```
## Output Files
The script creates two files in `./bench_out/` (or `$OUTPUT_DIR`):
| File | Description |
|------|-------------|
| `fio--.txt` | Formatted summary with tables, key metrics, and raw data |
| `fio--.json` | Raw fio JSON output for programmatic analysis |
## What to Look For
Focus on **p99.9 latency** in the `4k_qd1_jobs1` tests:
| p99.9 Latency | Assessment |
|---------------|------------|
| < 0.3ms | ✅ **Excellent** - True NVMe-class performance |
| < 0.5ms | ⚠️ **Acceptable** - Reasonable for most workloads |
| ≥ 0.5ms | ❌ **Poor** - Likely throttled, noisy neighbors, or not true NVMe |
**Warning signs:**
- IOPS that flatline at round numbers (e.g., 20,000) suggest rate limiting
- High IOPS with high latency indicates oversubscribed storage
- Erratic latency across tests suggests noisy neighbors
## Changelog
### v2.0.0 (2026-02-03)
- **New:** Formatted table output with Unicode box drawing
- **New:** Color-coded p99.9 latency (green/yellow/red)
- **New:** Key metrics summary section
- **New:** Pass/fail assessment against thresholds
- **New:** Progress indicator during tests
- **New:** Improved TXT output with multiple sections
- **Fixed:** Compatibility with various fio versions
- **Fixed:** Robust JSON parsing
### v1.0.0
- Initial release
## License
MIT
## Author
[Hayden James](https://linuxblog.io) - Linux systems analyst.