https://github.com/heavyai/heavyai-charting
Dimensional charting built to work natively with crossfilter rendered using d3.js
https://github.com/heavyai/heavyai-charting
charting-library crossfilter gpu interactive-visualization mapd visualization
Last synced: 5 months ago
JSON representation
Dimensional charting built to work natively with crossfilter rendered using d3.js
- Host: GitHub
- URL: https://github.com/heavyai/heavyai-charting
- Owner: heavyai
- License: other
- Created: 2017-05-01T16:12:49.000Z (almost 8 years ago)
- Default Branch: master
- Last Pushed: 2024-10-16T17:55:18.000Z (6 months ago)
- Last Synced: 2024-10-18T16:50:20.598Z (6 months ago)
- Topics: charting-library, crossfilter, gpu, interactive-visualization, mapd, visualization
- Language: JavaScript
- Homepage: https://heavyai.github.io/heavyai-charting/
- Size: 112 MB
- Stars: 398
- Watchers: 51
- Forks: 72
- Open Issues: 66
-
Metadata Files:
- Readme: README.md
- Contributing: .github/CONTRIBUTING.md
- License: LICENSE
Awesome Lists containing this project
- awesome-viz - MapD Charting - Dimensional charting built to work natively with crossfilter rendered using d3.js. ([↑](#contents) Cross Filtering)
README
# HEAVY.AI Charting
Dimensional charting built to work natively with crossfilter rendered using d3.js.
# Screenshots
#### Flights Dataset: Brushing on timeline with Bubble Chart and Row Chart

#### Tweets Dataset: Brushing on timeline and hovering on Pointmap datapoint which displays row information

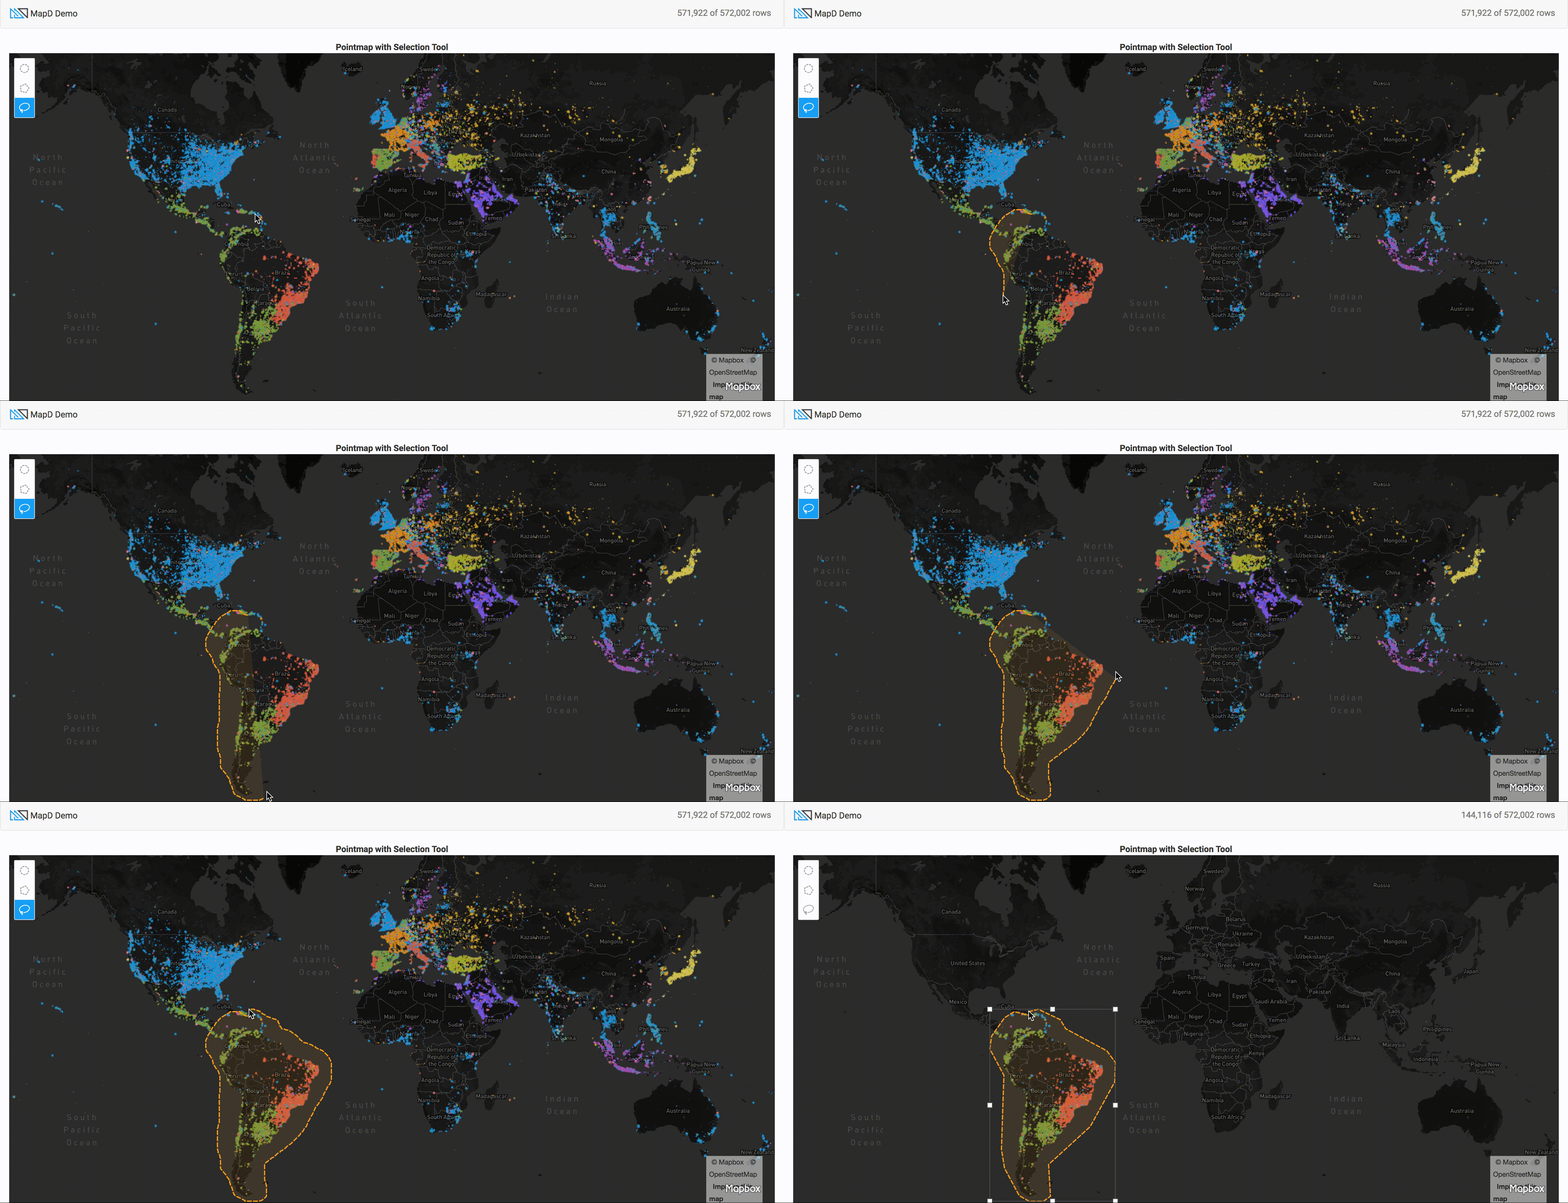
#### Tweets Dataset: Using draw-js tool on pointmap to select specific areas on a map

# Examples
Visit our [examples page](https://heavyai.github.io/heavyai-charting/example/) for ideas of what can be created with HEAVY.AI Charting
# Quick Start
##### Step 1: Install Dependencies
```bash
npm install #downloads all dependencies and devDependencies
```##### Step 2: Run Start Script
```bash
npm run start
or
npm run watch
```# Synopsis
HEAVY.AI Charting is a superfast charting library that works natively with [crossfilter](https://github.com/square/crossfilter) that is based off [dc.js](https://github.com/dc-js/dc.js). It is designed to work with HEAVY.AI Connector and HEAVY.AI Crossfilter to create charts instantly with our HeavyDB SQL Database. Please see [examples](#examples) for further understanding to quickly create interactive charts.
Our [Tweetmap Demo](https://www.heavy.ai/demos/tweetmap/) was made only using HEAVY.AI Charting.
# Documentation
Visit our [API Docs](https://heavyai.github.io/heavyai-charting/docs/) for additional information on HEAVY.AI Charting
# Testing
New components in HEAVY.AI Charting should be unit-tested and linted. All tests will be in the same folder as the new component.
```
+-- src
| +-- /mixins/new-mixin-component.js
| +-- /mixins/new-mixin-component.unit.spec.js
```The linter and all tests run on
```bash
npm run test
```To check only unit-tests run:
```bash
npm run test:unit
```### Linting
Please lint all your code in `@heavyai/charting/`. The lint config file can be found in `.eslintrc.json`. For new components, please fix all lint warnings and errors.
# Scripts
| Command | Description |
--- | ---
`npm run start` | Copies files for examples and then serves the example
`npm run build` | Runs webpack and builds js and css in `/dist`
`npm run docs` | Creates and opens docs
`npm run test` | Runs both linting and unit tests
`npm run clean` | Removes node modules, dist, docs, and example files# Documentation
The charting library uses [documentation.js](https://github.com/documentationjs/documentation) for API documentation. Docs can be built and viewed locally with the `npm run docs` command.## Contributing
Interested in contributing? We'd love for you to help! Check out [Contributing.MD](.github/CONTRIBUTING.md)