https://github.com/hendisantika/spring-boot-prometheus-grafana
Spring boot prometheus grafana dashboard example
https://github.com/hendisantika/spring-boot-prometheus-grafana
Last synced: 9 months ago
JSON representation
Spring boot prometheus grafana dashboard example
- Host: GitHub
- URL: https://github.com/hendisantika/spring-boot-prometheus-grafana
- Owner: hendisantika
- Created: 2018-10-31T00:09:28.000Z (about 7 years ago)
- Default Branch: master
- Last Pushed: 2025-03-31T10:45:48.000Z (9 months ago)
- Last Synced: 2025-03-31T11:33:05.664Z (9 months ago)
- Language: Java
- Size: 1.41 MB
- Stars: 5
- Watchers: 2
- Forks: 2
- Open Issues: 0
-
Metadata Files:
- Readme: README.md
Awesome Lists containing this project
README
Simple Grafana Dashboard for Spring Actuator Micrometer.
====
docker-compose.yml
----
You can start Prometheus and Grafana Containers with this docker-compose.yml.
```yaml
version: '3.9'
services:
prometheus:
image: prom/prometheus:latest
container_name: prometheus
volumes:
- ./prometheus.yml:/etc/prometheus/prometheus.yml
ports:
- 9090:9090
grafana:
image: grafana/grafana:latest
container_name: grafana
ports:
- 3000:3000
env_file:
- ./grafana.env
```
Prometheus Configuration (e.g. Docker for Mac)
----
```yaml
global:
scrape_interval: 15s
evaluation_interval: 15s
external_labels:
monitor: 'codelab-monitor'
rule_files:
# - './alert.rules'
scrape_configs:
- job_name: 'prometheus'
static_configs:
- targets:
- 'docker.for.mac.host.internal:9090'
- job_name: 'spring'
metrics_path: '/actuator/prometheus'
static_configs:
- targets:
- 'docker.for.mac.host.internal:8080'
- job_name: 'admin'
metrics_path: '/actuator/prometheus'
static_configs:
- targets:
- 'docker.for.mac.host.internal:8110'
- job_name: 'contents'
metrics_path: '/actuator/prometheus'
static_configs:
- targets:
- 'docker.for.mac.host.internal:8200'
- job_name: 'discovery'
metrics_path: '/prometheus'
static_configs:
- targets:
- 'docker.for.mac.host.internal:8100'
- job_name: 'frontend'
metrics_path: '/actuator/prometheus'
static_configs:
- targets:
- 'docker.for.mac.host.internal:8201'
- job_name: 'gw'
metrics_path: '/actuator/prometheus'
static_configs:
- targets:
- 'docker.for.mac.host.internal:8000'
- job_name: 'zipkin-server'
metrics_path: '//actuator/prometheus'
static_configs:
- targets:
- 'docker.for.mac.host.internal:9411'
```
You should change `docker.for.mac.host.internal` to the host address.
Grafana Configuration
----
Import `Java Micrometer Basics.json` to your Grafana Server or find this Dashboard(ID: 4683) on Grafana.com.
Spring Boot Configuration
----
```gradle
dependencies {
...
compile 'org.springframework.boot:spring-boot-starter-actuator'
compile 'io.micrometer:micrometer-spring-legacy:1.0.6'
compile 'io.micrometer:micrometer-registry-prometheus:1.0.6' // You should add this line for prometheus.
...
```
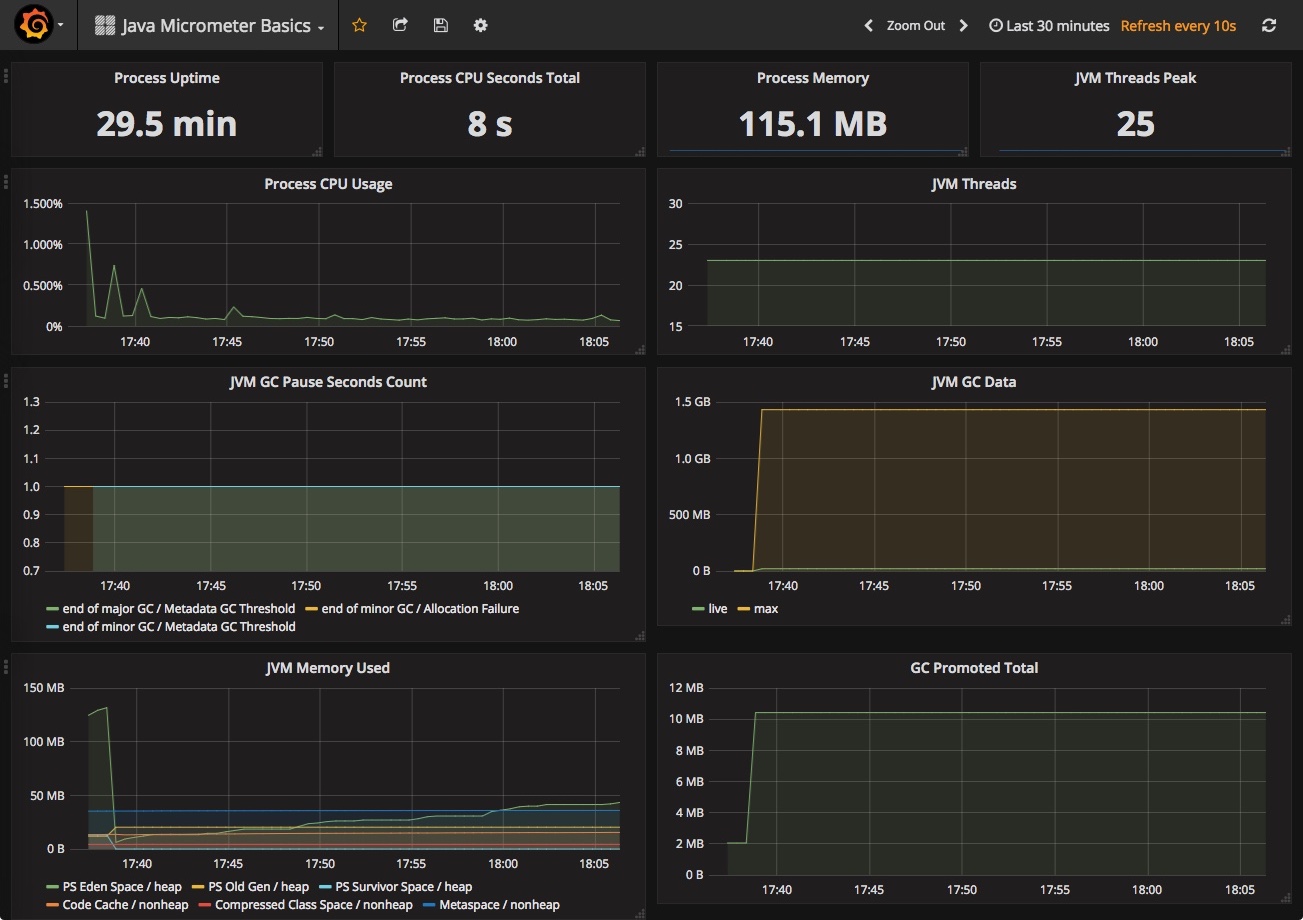
Prometheus Panel

Grafana JVM Micrometer
.png "Grafana JVM Micrometer")
You can start a sample project of Spring Boot (Ver.2.5.4) with this `proto` folder outside of containers.
Reference:
https://keepgrowing.in/tools/how-to-set-up-grafana-with-docker-and-connect-it-to-prometheus/
https://keepgrowing.in/tools/monitoring-spring-boot-projects-with-prometheus/