Ecosyste.ms: Awesome
An open API service indexing awesome lists of open source software.
https://github.com/hughjonesd/anim.plots
Simple animated plots for R
https://github.com/hughjonesd/anim.plots
animation graphics plot r
Last synced: 3 months ago
JSON representation
Simple animated plots for R
- Host: GitHub
- URL: https://github.com/hughjonesd/anim.plots
- Owner: hughjonesd
- Created: 2014-10-27T08:26:28.000Z (over 10 years ago)
- Default Branch: master
- Last Pushed: 2021-04-30T15:08:16.000Z (almost 4 years ago)
- Last Synced: 2024-11-01T18:51:49.419Z (4 months ago)
- Topics: animation, graphics, plot, r
- Language: R
- Size: 178 MB
- Stars: 8
- Watchers: 3
- Forks: 3
- Open Issues: 0
-
Metadata Files:
- Readme: README.md
Awesome Lists containing this project
README
# anim.plots
[](https://cran.r-project.org/package=anim.plots)
[](https://github.com/hughjonesd/anim.plots/actions)
`anim.plots` provides simple animated versions of basic R plots, using the `animation`
package. It includes animated versions of `plot`, `barplot`, `persp`, `contour`,
`filled.contour`, `hist`, `curve`, `points`, `lines`, `text`, `symbols`, `segments`, and
`arrows`.
## Installation
Stable version from CRAN:
```R
install.packages("anim.plots")
```
Latest version from github:
```R
# install.packages("devtools")
devtools::install_github("anim.plots/hughjonesd")
```
## Example
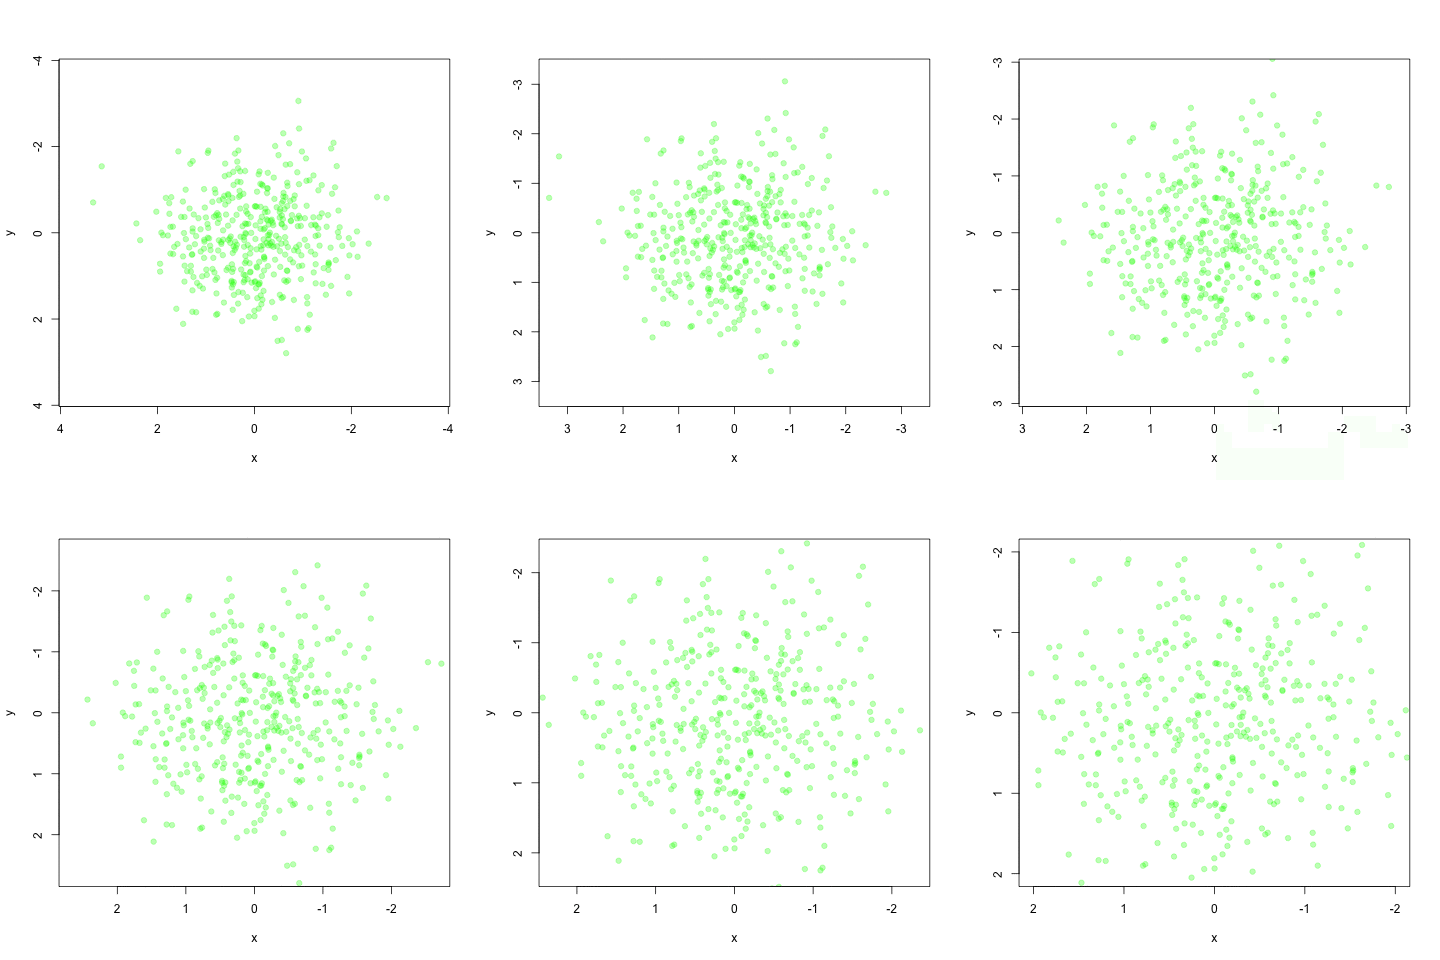
Zooming into a bivariate normal distribution:
```R
x <- rep(rnorm(400), 10)
y <- rep(rnorm(400), 10)
xlims <- 4 * 2^-(1:10/10)
ylims <- xlims <- rbind(xlims, -xlims)
anim.plot(x, y, times = 10, speed = 2, xlim = xlims, ylim = ylims, col = rgb(0,1,0,.3), pch = 19)
```

## More information
* [Vignette](https://hughjonesd.github.io/anim.plots/anim.plots.html)
* [Web presentation](https://hughjonesd.github.io/anim.plots/anim-plots-presentation.html)
## Feedback
Got a nice example?
Tweet it.