https://github.com/hustcc/pyg2plot
🎨 Python3 binding for `@AntV/G2Plot` Plotting Library .
https://github.com/hustcc/pyg2plot
antv g2plot visualization
Last synced: about 1 year ago
JSON representation
🎨 Python3 binding for `@AntV/G2Plot` Plotting Library .
- Host: GitHub
- URL: https://github.com/hustcc/pyg2plot
- Owner: hustcc
- License: mit
- Created: 2021-01-13T01:30:34.000Z (over 5 years ago)
- Default Branch: main
- Last Pushed: 2022-11-29T10:16:32.000Z (over 3 years ago)
- Last Synced: 2025-04-08T13:05:45.903Z (over 1 year ago)
- Topics: antv, g2plot, visualization
- Language: Python
- Homepage:
- Size: 50.8 KB
- Stars: 1,076
- Watchers: 11
- Forks: 115
- Open Issues: 9
-
Metadata Files:
- Readme: README.md
- License: LICENSE
Awesome Lists containing this project
README
# PyG2Plot
> 🎨 Python3 binding for [`@AntV/G2Plot`](https://github.com/antvis/G2Plot) which an interactive and responsive charting library. Based on the grammar of graphics, you can easily make superior statistical charts through a few lines of code. `PyG2Plot` is inspired by pyecharts.
[](https://pypi.python.org/pypi/pyg2plot)
[](https://github.com/hustcc/pyg2plot/actions?query=workflow%3Abuild)
[](https://pypi.python.org/pypi/pyg2plot)

**Document**: [中文说明文档](./README_ZH.md) · [Drawing statistical plots](./docs/plot.md) · [In Jupyter Notebook](./docs/jupyter.md) · [Principles](./docs/how.md)
## Installation
```bash
$ pip install pyg2plot
```
## Usage
#### **render HTML**
```py
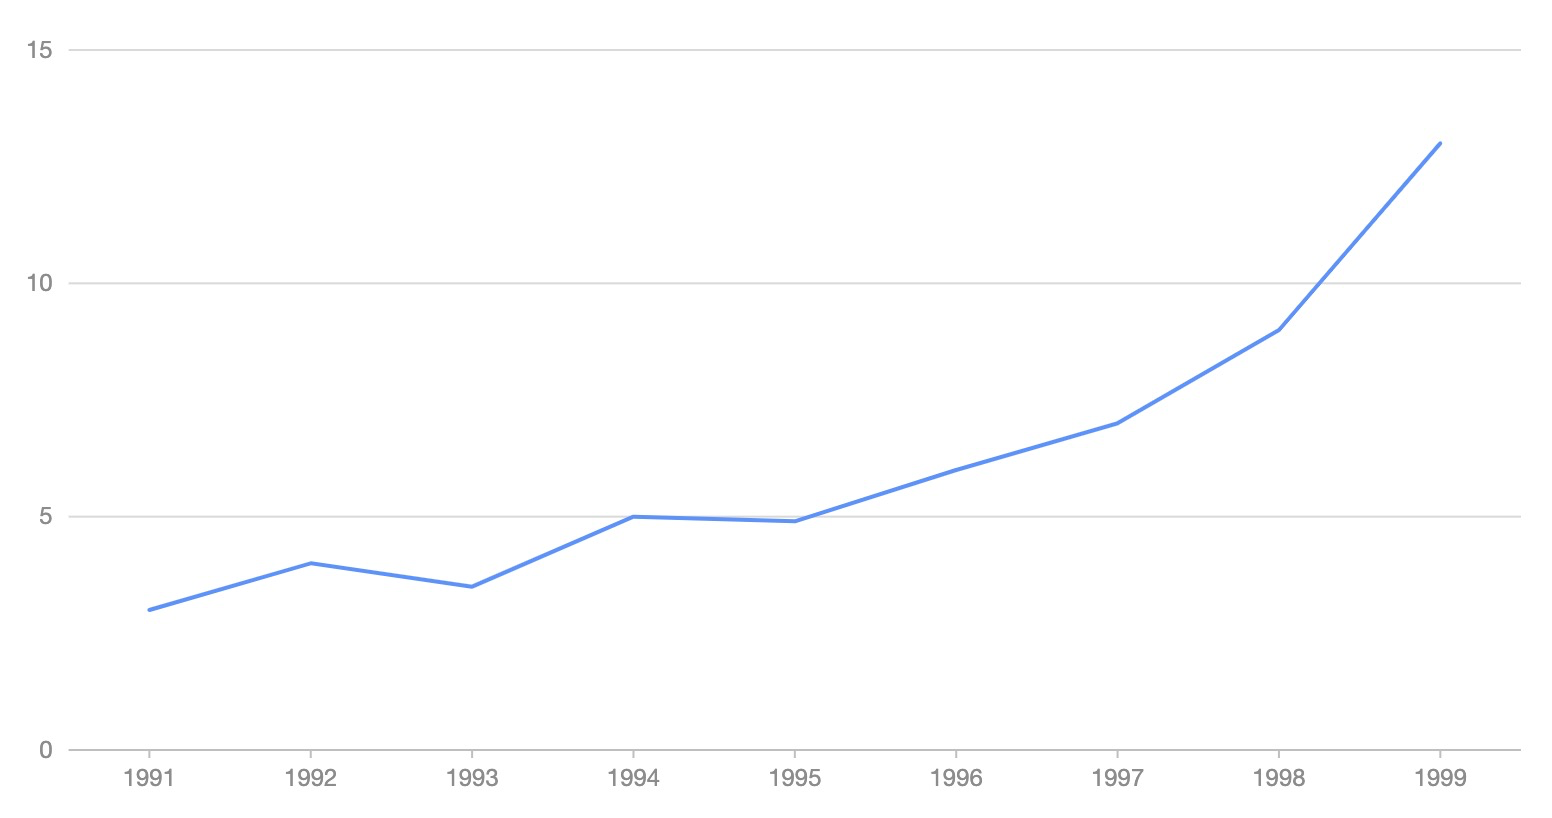
from pyg2plot import Plot
line = Plot("Line")
line.set_options({
"data": [
{ "year": "1991", "value": 3 },
{ "year": "1992", "value": 4 },
{ "year": "1993", "value": 3.5 },
{ "year": "1994", "value": 5 },
{ "year": "1995", "value": 4.9 },
{ "year": "1996", "value": 6 },
{ "year": "1997", "value": 7 },
{ "year": "1998", "value": 9 },
{ "year": "1999", "value": 13 },
],
"xField": "year",
"yField": "value",
})
# 1. render html file
line.render("plot.html")
# 2. render html string
line.render_html()
```
#### **render Jupyter**
```py
from pyg2plot import Plot
line = Plot("Line")
line.set_options({
"height": 400, # set a default height in jupyter preview
"data": [
{ "year": "1991", "value": 3 },
{ "year": "1992", "value": 4 },
{ "year": "1993", "value": 3.5 },
{ "year": "1994", "value": 5 },
{ "year": "1995", "value": 4.9 },
{ "year": "1996", "value": 6 },
{ "year": "1997", "value": 7 },
{ "year": "1998", "value": 9 },
{ "year": "1999", "value": 13 },
],
"xField": "year",
"yField": "value",
})
# 1. render in notebook
line.render_notebook()
# 2. render in jupyter lab
line.render_jupyter_lab()
```
#### **use JavaScript callback**
```py
from pyg2plot import Plot, JS
line = Plot("Line")
line.set_options({
"height": 400, # set a default height in jupyter preview
"data": [
{ "year": "1991", "value": 3 },
{ "year": "1992", "value": 4 },
{ "year": "1993", "value": 3.5 },
{ "year": "1994", "value": 5 },
{ "year": "1995", "value": 4.9 },
{ "year": "1996", "value": 6 },
{ "year": "1997", "value": 7 },
{ "year": "1998", "value": 9 },
{ "year": "1999", "value": 13 },
],
"xField": "year",
"yField": "value",
"lineStye": JS('''function() {
return { stroke: 'red' };
}''')
})
```
Use `JS` API, you can use JavaScript syntax for callback.
## API
Now, only has one API of `pyg2plot`.
- **Plot**
1. *Plot(plot_type: str)*: get an instance of `Plot` class.
2. *plot.set_options(options: object)*: set the options of [G2Plot](https://g2plot.antv.vision/) into instance.
3. *plot.render(path, env, **kwargs)*: render out html file by setting the path, jinja2 env and kwargs.
4. *plot.render_notebook(env, **kwargs)*: render plot on jupyter preview.
5. *plot.render_jupyter_lab(env, **kwargs)*: render plot on jupyter lab preview.
6. *plot.render_html(env, **kwargs)*: render out html string by setting jinja2 env and kwargs.
7. *plot.dump_js_options(env, **kwargs)*: dump js options by setting jinja2 env and kwargs, use it for HTTP request.
> More apis is on the way.
## License
MIT@[hustcc](https://github.com/hustcc).