Ecosyste.ms: Awesome
An open API service indexing awesome lists of open source software.
https://github.com/ibrahimmudassar/gravity-visualization
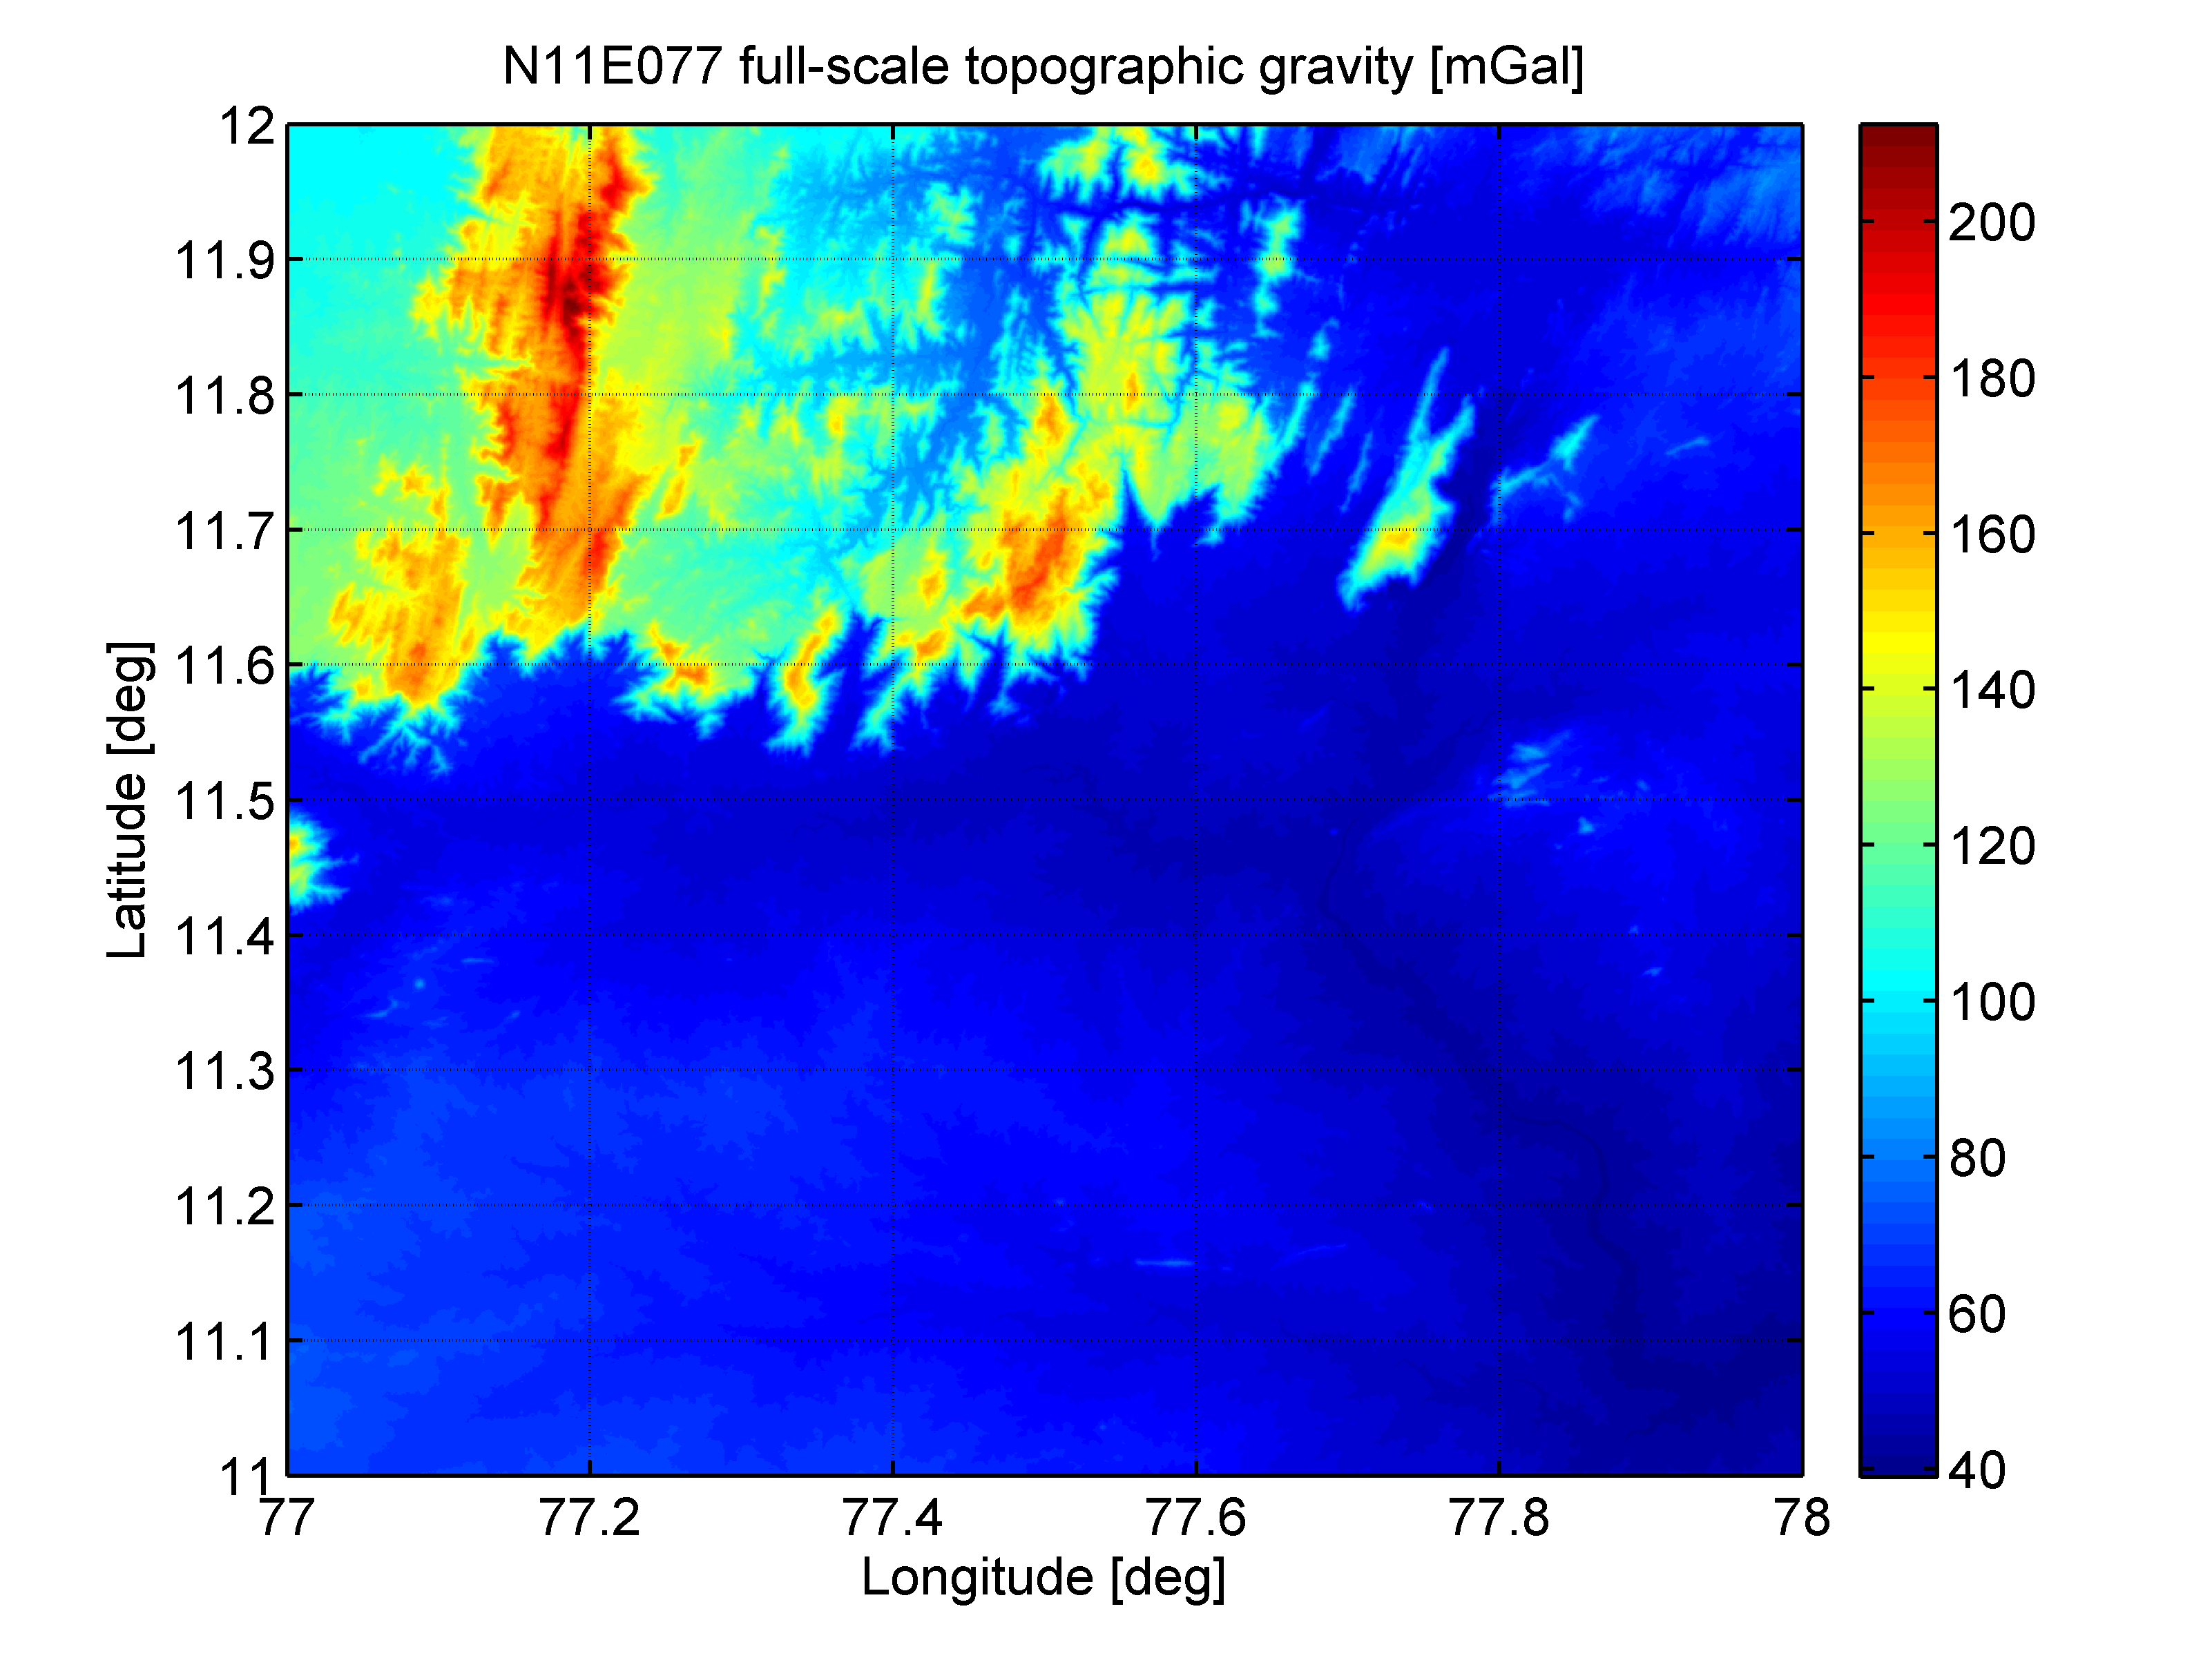
Visualizing the SRTM2gravity topographic gravity/terrain correction model
https://github.com/ibrahimmudassar/gravity-visualization
Last synced: 5 days ago
JSON representation
Visualizing the SRTM2gravity topographic gravity/terrain correction model
- Host: GitHub
- URL: https://github.com/ibrahimmudassar/gravity-visualization
- Owner: ibrahimmudassar
- License: agpl-3.0
- Created: 2023-03-08T01:36:34.000Z (almost 2 years ago)
- Default Branch: main
- Last Pushed: 2023-10-16T01:01:23.000Z (over 1 year ago)
- Last Synced: 2024-12-23T08:45:28.590Z (about 2 months ago)
- Language: Python
- Homepage:
- Size: 12.7 MB
- Stars: 2
- Watchers: 1
- Forks: 0
- Open Issues: 0
-
Metadata Files:
- Readme: README.md
- License: LICENSE
Awesome Lists containing this project
README
# Gravity-Visualization
This work seeks to visualize the work done by Hirt et al. (2019).
The Readme for their research is [here.](https://ddfe.curtin.edu.au/models/SRTM2gravity2018/SRTM2gravity_Readme.dat)
This project initially started by perusing the [GRACE Tellus Gravity Recovery & Climate Experiment](https://grace.jpl.nasa.gov/data/get-data/)
I also looked at data from:
* [Gravity Predictor Service](https://geodesy.noaa.gov/web_services/grav-d.shtml)
* [CSR Low-Degree Gravity Harmonics GRACE Satellite](https://filedrop.csr.utexas.edu/pub/slr/degree_5/CSR_Monthly_5x5_Gravity_Harmonics.txt)
* [National Centers for Environmental Information (NCEI)](https://www.ngdc.noaa.gov/mgg/gravity/)
# Output
## After


## Before

# How To Use
Please type in the specific location you want and it will show a 3d Histogram and 2d Histogram with your results.
The 2D visualization of all possible locations is here.

# TODO
* Type in a latitude and longitude and it outputs automatically (if available) without searching for the link. In lieu of this, you may type the link by modifying the code. [All possible links are here.](/filenames.txt)
* The ability to input a square and it will concatenate the multiple location data files together and output the concatenated data
* Create Interactive Globe Model of this to try to imitate the [gravity potato](https://user-images.githubusercontent.com/22484328/223882296-e0e7e285-f51d-4bbb-9c21-b056ce6c29e6.png) Google Earth style
# Thanks
I want to thank (in no particular order):
* Cornelia Freund, Technical University Munich
* Dr. Christian Hirt, Technical University Munich
* Dr. Michael Kuhn, Curtin University
* Dr. John Ries, UT Austin
* Brian Meyer, NOAA
Without you, this project would have gone far more frustratingly