https://github.com/ignacio82/vizdraws
vizdraws creates interactive visualizations using draws from a prior and posterior distributions.
https://github.com/ignacio82/vizdraws
bayesian visualization visualization-library visualization-tools
Last synced: 9 months ago
JSON representation
vizdraws creates interactive visualizations using draws from a prior and posterior distributions.
- Host: GitHub
- URL: https://github.com/ignacio82/vizdraws
- Owner: ignacio82
- Created: 2017-11-19T19:54:27.000Z (over 8 years ago)
- Default Branch: master
- Last Pushed: 2025-06-04T02:56:19.000Z (about 1 year ago)
- Last Synced: 2025-10-12T12:58:11.237Z (9 months ago)
- Topics: bayesian, visualization, visualization-library, visualization-tools
- Language: JavaScript
- Homepage: http://vizdraws.martinez.fyi
- Size: 1.22 MB
- Stars: 9
- Watchers: 4
- Forks: 10
- Open Issues: 6
-
Metadata Files:
- Readme: README.Rmd
- Changelog: NEWS.md
Awesome Lists containing this project
- awesome-shiny-extensions - vizdraws - Interactive visualization of Bayesian prior and posterior distribution draws. (Visualization / General-Purpose)
README
---
output:
md_document:
variant: gfm
---
```{r, echo = FALSE}
knitr::opts_chunk$set(
collapse = TRUE,
comment = "#>",
fig.path = "README-"
)
```
# vizdraws
**vizdraws** creates interactive visualizations using draws from a prior and posterior distributions.
[](https://cran.r-project.org/package=vizdraws)
[](https://cran.r-project.org/package=vizdraws)
[](https://cran.r-project.org/package=vizdraws)
[](https://cran.r-project.org/package=vizdraws)
## Installation
``` r
install.packages('vizdraws')
```
The latest development version can be installed from github:
``` r
# install.packages("remotes")
remotes::install_github('ignacio82/vizdraws')
```
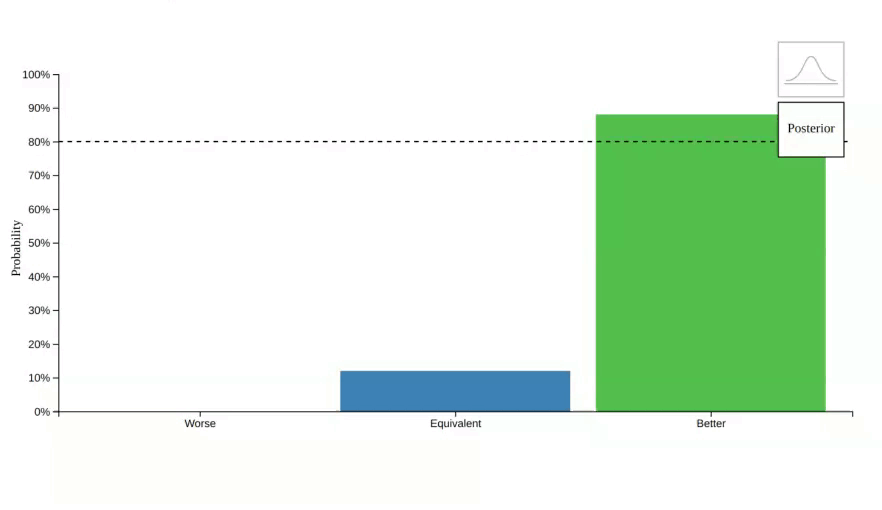
## Example
This is a example which shows you how to how to visualize the transition from the prior to the posterior:
```{r example, eval=FALSE}
library(vizdraws)
set.seed(9782)
vizdraws(prior = rnorm(10000, 0, 1), posterior = rnorm(10000, 1.1, 0.5), MME = 0.5, threshold = 0.8)
```
### Notes
The bell-curve icon was [created by Davo Sime.](https://thenounproject.com/term/bell-curve/614251/)