https://github.com/igniteui/er-dashboard-sample
The ER Dashboard sample demonstrates the capabilities of multiple Ignite UI controls working together into a single complex view designed for mobile tablet devices. The main part of the sample is several charts displaying different kinds of information about patients admitted to the emergency ward of a hospital. The sample shows how the same information can be displayed in a grid and how to switch between views. Combo boxes are used to select different medical parameters to be displayed dynamically update the data behind the charts. Additional buttons let you change the chart visualization with the same data.
https://github.com/igniteui/er-dashboard-sample
Last synced: 11 months ago
JSON representation
The ER Dashboard sample demonstrates the capabilities of multiple Ignite UI controls working together into a single complex view designed for mobile tablet devices. The main part of the sample is several charts displaying different kinds of information about patients admitted to the emergency ward of a hospital. The sample shows how the same information can be displayed in a grid and how to switch between views. Combo boxes are used to select different medical parameters to be displayed dynamically update the data behind the charts. Additional buttons let you change the chart visualization with the same data.
- Host: GitHub
- URL: https://github.com/igniteui/er-dashboard-sample
- Owner: IgniteUI
- License: mit
- Created: 2013-11-06T20:22:35.000Z (over 12 years ago)
- Default Branch: master
- Last Pushed: 2015-04-27T16:30:31.000Z (about 11 years ago)
- Last Synced: 2025-06-26T15:51:48.334Z (12 months ago)
- Language: JavaScript
- Size: 22.5 MB
- Stars: 13
- Watchers: 26
- Forks: 10
- Open Issues: 0
-
Metadata Files:
- Readme: README.md
- License: LICENSE
Awesome Lists containing this project
README
# Ignite UI Patient Management & Vitals Application Sample
[](http://igniteui.com/er-dashboard-sample)
[http://igniteui.com/er-dashboard-sample](http://igniteui.com/er-dashboard-sample)
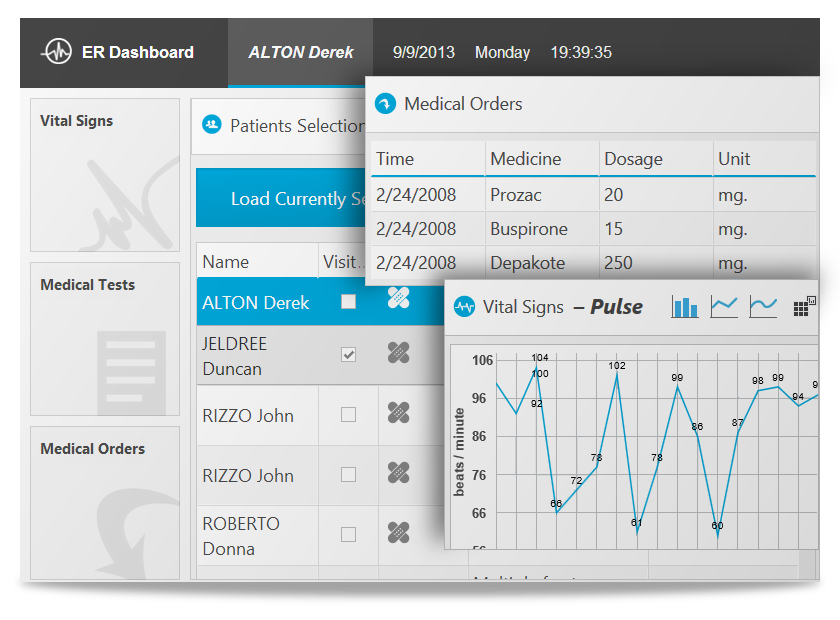
The ER Dashboard sample demonstrates the capabilities of multiple Ignite UI controls working together into a single complex view designed for mobile tablet devices. The main part of the sample is several charts displaying different kinds of information about patients admitted to the emergency ward of a hospital. The sample shows how the same information can be displayed in a grid and how to switch between views. Combo boxes are used to select different medical parameters to be displayed dynamically update the data behind the charts. Additional buttons let you change the chart visualization with the same data.
## What is Ignite UI?
[](http://igniteui.com)
[Ignite UI](http://igniteui.com/) is an advanced HTML5+ toolset that helps you create stunning, modern Web apps. Building on jQuery and jQuery UI, it primarily consists of feature rich, high-performing UI controls/widgets such as all kinds of charts, data visualization maps, (hierarchical, editable) data grids, pivot grids, enhanced editors (combo box, masked editors, HTML editor, date picker, to name a few), flexible data source connectors, and a whole lot more. Too many to list here - check out [the site](http://igniteui.com/) for more info and to [download](https://igniteui.com/download) a trial.
Ignite UI is not just another library created in someone's free time. It is commercial-ready, extremely well-tested, tuned for top performance, designed for good UX, and backed by [Infragistics](http://www.infragistics.com/), an experience-focused company with a track record of over 24 years of experience in providing enterprise-ready, high-performance user interface tools for web, windows and mobile environments.
[](http://infragistics.com)