https://github.com/insightsengineering/rtables
Reporting tables with R
https://github.com/insightsengineering/rtables
pharmaceuticals r tables
Last synced: 4 months ago
JSON representation
Reporting tables with R
- Host: GitHub
- URL: https://github.com/insightsengineering/rtables
- Owner: insightsengineering
- License: other
- Created: 2017-11-15T13:22:09.000Z (over 8 years ago)
- Default Branch: main
- Last Pushed: 2026-03-23T21:42:21.000Z (4 months ago)
- Last Synced: 2026-03-24T20:00:15.758Z (4 months ago)
- Topics: pharmaceuticals, r, tables
- Language: R
- Homepage: https://insightsengineering.github.io/rtables/
- Size: 136 MB
- Stars: 252
- Watchers: 17
- Forks: 51
- Open Issues: 34
-
Metadata Files:
- Readme: README.Rmd
- Changelog: NEWS.md
- Contributing: .github/CONTRIBUTING.md
- License: LICENSE
- Code of conduct: .github/CODE_OF_CONDUCT.md
- Codeowners: .github/CODEOWNERS
Awesome Lists containing this project
- top-pharma50 - **insightsengineering/rtables** - 06-07 21:27:39 | (Ranked by starred repositories)
- top-life-sciences - **insightsengineering/rtables** - 06-07 21:27:39 | (Ranked by starred repositories)
- jimsghstars - insightsengineering/rtables - Reporting tables with R (R)
README
---
output: github_document
editor_options:
chunk_output_type: console
---
```{r, echo = FALSE}
knitr::opts_chunk$set(
collapse = TRUE,
comment = "#>",
fig.path = "man/figures/README-"
)
suppressPackageStartupMessages(library(rtables))
suppressPackageStartupMessages(library(dplyr))
```
# rtables 
[](https://github.com/insightsengineering/rtables/actions/workflows/check.yaml)
[](https://insightsengineering.github.io/rtables/)
[](https://raw.githubusercontent.com/insightsengineering/rtables/_xml_coverage_reports/data/main/coverage.xml)


[](https://www.repostatus.org/#active)
[](https://github.com/insightsengineering/rtables/issues?q=is%3Aissue+is%3Aopen+sort%3Aupdated-desc)
[](https://CRAN.R-project.org/package=rtables)
[](https://github.com/insightsengineering/rtables/tree/main)
## Reporting Tables with R
The `rtables` R package was designed to create and display complex tables with R. The cells in an `rtable` may contain
any high-dimensional data structure which can then be displayed with cell-specific formatting instructions. Currently,
`rtables` can be outputted in `ascii` `html`, and `pdf`, as well Power Point (via conversion to `flextable` objects). `rtf` support is in development and will be in a future release.
`rtables` is developed and copy written by `F. Hoffmann-La Roche` and it is released open source under Apache
License Version 2.
`rtables` development is driven by the need to create regulatory ready tables for health authority review. Some of the key requirements for this undertaking are listed below:
* cell values and their visualization separate (i.e. no string based tables)
- values need to be programmatically accessible in their non-rounded state for cross-checking
* multiple values displayed within a cell
* flexible tabulation framework
* flexible formatting (cell spans, rounding, alignment, etc.)
* multiple output formats (html, ascii, latex, pdf, xml)
* flexible pagination in both horizontal and vertical directions
* distinguish between name and label in the data structure to work with `CDISC` standards
* title, footnotes, cell cell/row/column references
`rtables` currently covers virtually all of these requirements, and further advances remain under active development.
## Installation
`rtables` is available on CRAN and you can install the latest released version with:
```r
install.packages("rtables")
```
or you can install the latest development version directly from GitHub with:
```r
# install.packages("pak")
pak::pak("insightsengineering/rtables")
```
Packaged releases (both those on CRAN and those between official CRAN releases) can be
found in the [releases list](https://github.com/insightsengineering/rtables/releases).
To understand how to use this package, please refer to the [Introduction to `rtables`](https://insightsengineering.github.io/rtables/main/articles/rtables.html) article, which provides multiple examples of code implementation.
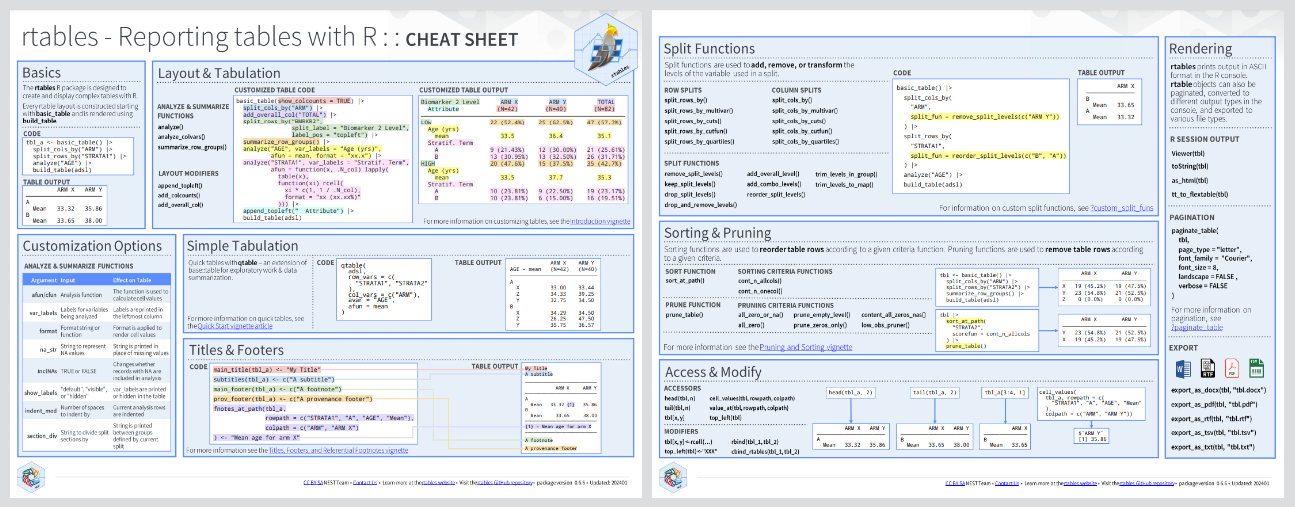
## Cheatsheet
## Usage
We first demonstrate with a demographic table-like example and then show the creation of a more complex table.
```{r, message=FALSE}
library(rtables)
lyt <- basic_table() %>%
split_cols_by("ARM") %>%
analyze(c("AGE", "BMRKR1", "BMRKR2"), function(x, ...) {
if (is.numeric(x)) {
in_rows(
"Mean (sd)" = c(mean(x), sd(x)),
"Median" = median(x),
"Min - Max" = range(x),
.formats = c("xx.xx (xx.xx)", "xx.xx", "xx.xx - xx.xx")
)
} else if (is.factor(x) || is.character(x)) {
in_rows(.list = list_wrap_x(table)(x))
} else {
stop("type not supported")
}
})
build_table(lyt, ex_adsl)
```
```{r, message=FALSE}
library(rtables)
library(dplyr)
## for simplicity grab non-sparse subset
ADSL <- ex_adsl %>% filter(RACE %in% levels(RACE)[1:3])
biomarker_ave <- function(x, ...) {
val <- if (length(x) > 0) round(mean(x), 2) else "no data"
in_rows(
"Biomarker 1 (mean)" = rcell(val)
)
}
basic_table(show_colcounts = TRUE) %>%
split_cols_by("ARM") %>%
split_cols_by("BMRKR2") %>%
split_rows_by("RACE", split_fun = trim_levels_in_group("SEX")) %>%
split_rows_by("SEX") %>%
summarize_row_groups() %>%
analyze("BMRKR1", biomarker_ave) %>%
build_table(ADSL)
```
# Acknowledgments
We would like to thank everyone who has made `rtables` a better project by providing feedback and improving examples & vignettes. The following list of contributors is alphabetical:
Maximo Carreras, Francois Collins, Saibah Chohan, Tadeusz Lewandowski, Nick Paszty, Nina Qi, Jana Stoilova, Heng Wang, Godwin Yung
## Presentations
- R in Pharma 2023
- Generating Tables, Listings, and Graphs using NEST / [cardinal](https://pharmaverse.github.io/cardinal/) [[Video](https://www.youtube.com/watch?v=YPmbLPSYFYM)]
- BBS Session on Regulatory Submissions of Clinical Trials [[Video](https://www.youtube.com/watch?v=yZS4OBuJe_Q)]
- R Medicine Virtual Conference 2023 [[Video](https://www.youtube.com/watch?v=sxFsavKI7s4)]
- Advanced rtables Training 2023 [[Part 1 Slides](https://github.com/insightsengineering/rtables/blob/main/inst/extdata/Advanced_rtables_part1.pdf)] [[Part 2 Slides](https://github.com/insightsengineering/rtables/blob/main/inst/extdata/Advances_rtables_part2.pdf)]
- R in Pharma 2022 - Creating Submission-Quality Clinical Trial Reporting Tables in R with rtables [[Slides](https://github.com/insightsengineering/rtables/blob/main/inst/extdata/Clinical_Trial_Reporting_Tables_in_R.pdf)] [[Video](https://www.youtube.com/watch?v=zBm_NZ0VtKs)]
- R Consortium 2022
- R Adoption Series - Reporting Table Creation in R [[Video](https://www.youtube.com/watch?v=1i6vOId2h4A)] [[Slides](https://github.com/insightsengineering/rtables/blob/main/inst/extdata/r_adoption_slides.pdf)]
- Tables in Clinical Trials with R [[Book](https://rconsortium.github.io/rtrs-wg/)]
- useR! 2020 - rtables Layouting and Tabulation Framework [[Video](https://www.youtube.com/watch?v=CBQzZ8ZhXLA)]