https://github.com/izikeros/trend_classifier
Library for automated signal segmentation, trend classification and analysis.
https://github.com/izikeros/trend_classifier
algorithmic-trading algotrading timeseries-segmentation trading-bot trend-analysis trend-detection
Last synced: about 1 year ago
JSON representation
Library for automated signal segmentation, trend classification and analysis.
- Host: GitHub
- URL: https://github.com/izikeros/trend_classifier
- Owner: izikeros
- License: mit
- Created: 2022-08-30T14:57:00.000Z (almost 4 years ago)
- Default Branch: main
- Last Pushed: 2024-07-19T12:12:04.000Z (about 2 years ago)
- Last Synced: 2024-11-26T10:45:27.159Z (over 1 year ago)
- Topics: algorithmic-trading, algotrading, timeseries-segmentation, trading-bot, trend-analysis, trend-detection
- Language: Python
- Homepage:
- Size: 740 KB
- Stars: 28
- Watchers: 1
- Forks: 9
- Open Issues: 3
-
Metadata Files:
- Readme: README.md
- Changelog: CHANGELOG.md
- License: LICENSE
Awesome Lists containing this project
README
# Trend classifier


[](https://results.pre-commit.ci/latest/github/izikeros/trend_classifier/main)
[](https://github.com/izikeros/trend_classifier/actions/workflows/black.yml)
[](https://github.com/izikeros/trend_classifier/actions/workflows/flake8.yml)
[](https://github.com/izikeros/trend_classifier/actions/workflows/pytest.yml)
[](https://codeclimate.com/github/izikeros/trend_classifier/maintainability)
[](https://codecov.io/gh/izikeros/trend_classifier)
Library for automated signal segmentation, trend classification and analysis.
## Installation
1. The package is pip-installable. To install it, run:
```sh
pip3 install trend-classifier
```
## Usage
### Pandas DataFrame Input
usage:
```python
import yfinance as yf
from trend_classifier import Segmenter
# download data from yahoo finance
df = yf.download("AAPL", start="2018-09-15", end="2022-09-05", interval="1d", progress=False)
x_in = list(range(0, len(df.index.tolist()), 1))
y_in = df["Adj Close"].tolist()
seg = Segmenter(x_in, y_in, n=20)
seg.calculate_segments()
```
For graphical output use `Segmenter.plot_segments()`:
```python
seg.plot_segments()
```

After calling method `Segmenter.calculate_segments()` segments are identified and information is stored in `Segmenter.segments` as list of Segment objects. Each Segment object. Each Segment object has attributes such as 'start', 'stop' - range of indices for the extracted segment, slope and many more attributes that might be helpful for further analysis.
Exemplary info on one segment:
```python
from devtools import debug
debug(seg.segments[3])
```
and you should see something like this:
```
seg.segments[3]: Segment(
start=154,
stop=177,
slope=-0.37934038908585044,
offset=109.54630934894907,
slopes=[
-0.45173184100846725,
-0.22564684358754555,
0.15555037018051593,
0.34801127785130714,
],
offsets=[
121.65628807526804,
83.56079272220015,
17.32660986821478,
-17.86417581658647,
],
slopes_std=0.31334199799377654,
offsets_std=54.60900279722876,
std=0.933497081795997,
span=82.0,
reason_for_new_segment='offset',
)
```
export results to tabular format (pandas DataFrame):
```python
seg.segments.to_dataframe()
```
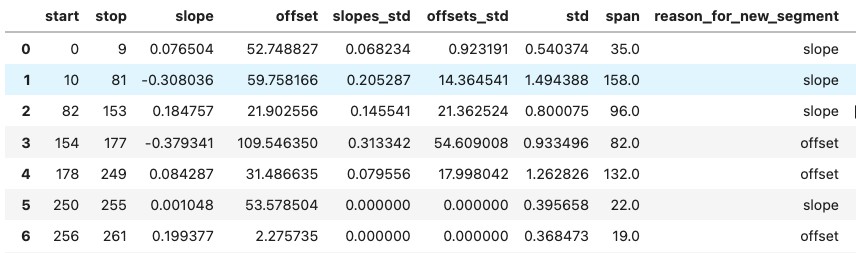
(**NOTE:** for clarity reasons, not all columns are shown in the screenshot above)
## Alternative approach
- Smooth out the price data using the Savitzky-Golay filter,
- label the highs and lows.
- higher highs and higher lows indicates an uptrend.
The requirement here is than you need OHLC data for the assets you would like to analyse.
## License
[MIT](LICENSE) © [Krystian Safjan](https://safjan.com/).