https://github.com/jacklandrin/jlconsolelog
A convenient In-App floating log console with Swift for iOS
https://github.com/jacklandrin/jlconsolelog
Last synced: about 1 month ago
JSON representation
A convenient In-App floating log console with Swift for iOS
- Host: GitHub
- URL: https://github.com/jacklandrin/jlconsolelog
- Owner: jacklandrin
- License: mit
- Created: 2020-04-27T16:49:22.000Z (about 5 years ago)
- Default Branch: master
- Last Pushed: 2022-07-11T13:25:37.000Z (almost 3 years ago)
- Last Synced: 2025-04-06T22:11:38.401Z (2 months ago)
- Language: Swift
- Homepage: http://www.jacklandrin.com/2020/04/28/jlconsolelog/
- Size: 152 KB
- Stars: 17
- Watchers: 1
- Forks: 1
- Open Issues: 0
-
Metadata Files:
- Readme: README.md
- License: LICENSE.md
Awesome Lists containing this project
README
# JLConsoleLog
  
## What is JLConsoleLog?
**JLConsoleLog** is an awesome tool In-App to help swift developer log information in both development and production environment. You won't miss any key and useful logs about the bugs in non-debug mode. You also can integrate it in your project's backdoor toolkit, it will help you solve vital issues.
## How to operate it?
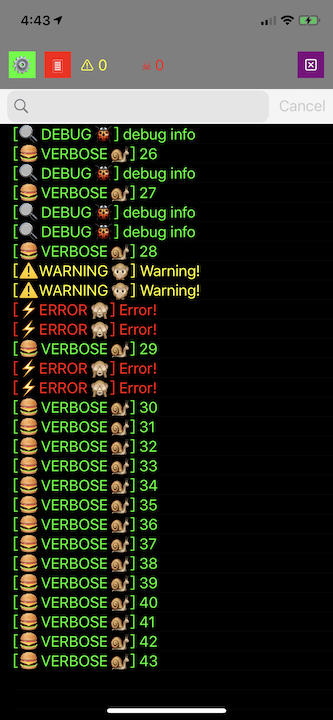
JLConsoleLog supports three types of style (display mode) -- **Floating**, **Bubble** and **FullScreen**
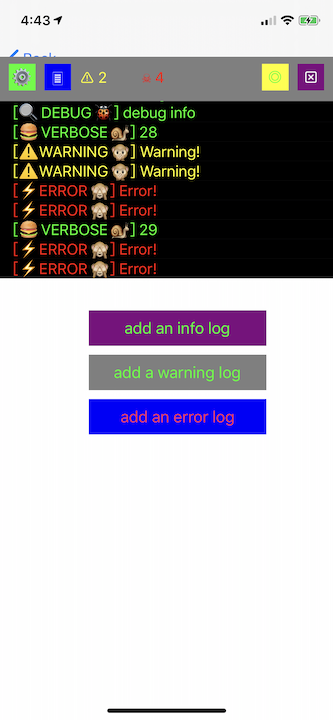
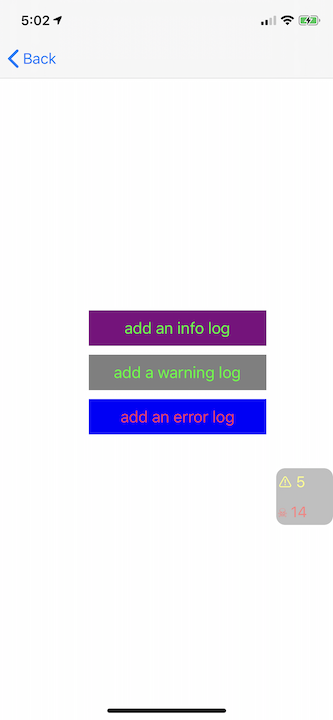
There are four buttons on the option view of floating mode. The first button is setting button where you can clear all logs from this console, filter categories and levels. The second one is for switching between floating and fullscreen mode. If the third one is pressed, the console will be a translucent bubble that only displays warning and error count. The last one is close button.
The floating console could become translucent automatically after 5s, if you don't touch it. Additionally, you can drag floating console and bubble to anywhere to avoid disturb you.
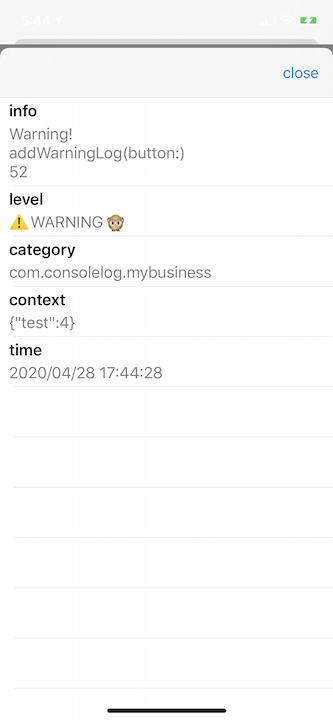
While you tap a log cell, you can enter the detail page of log.
---
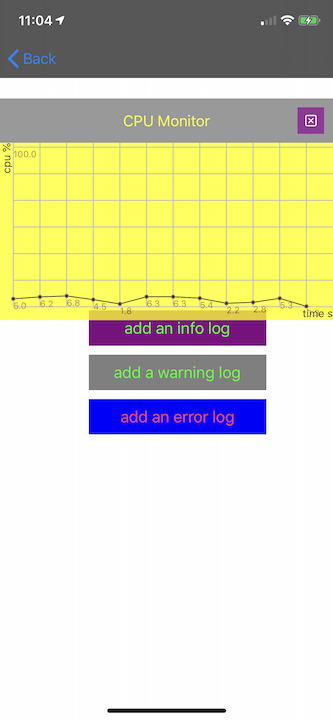
Performance monitor is a new function. You can invoke a monitor chart from bubble button now.
## How to use it in your project?
The **JLConsoleController** is the console's controller opened for developers. It contains a shared instance. You could set **style** and **logEnabled** via it. While you set its style (display mode), the console will immediately show in terms of you given. Like this:
```
if JLConsoleController.shared.style == .Hidden {
JLConsoleController.shared.style = .Floating //show console in floating fashion
} else {
JLConsoleController.shared.style = .Hidden //hide console
}
```
If **logEnabled** is true, the console will collect log data, vice verse.
```
JLConsoleController.shared.logEnabled = true
```
A series functions are offered to log.
```
func JLLevelLog(level: JLConsoleLogLevel, category: JLConsoleLogCategory, hasFollowingAction:Bool = false, needPrint:Bool = false, contextData:Dictionary , formats: String...)
func JLVerboseLog( category: JLConsoleLogCategory, hasFollowingAction:Bool = false, needPrint:Bool = false, contextData:Dictionary , formats: String...)
func JLDebugLog( category: JLConsoleLogCategory, hasFollowingAction:Bool = false, needPrint:Bool = false, contextData:Dictionary , formats: String...)
func JLInfoLog( category: JLConsoleLogCategory, hasFollowingAction:Bool = false, needPrint:Bool = false, contextData:Dictionary , formats: String...)
func JLWarningLog( category: JLConsoleLogCategory, hasFollowingAction:Bool = false, needPrint:Bool = false, contextData:Dictionary , formats: String...)
func JLErrorLog( category: JLConsoleLogCategory, hasFollowingAction:Bool = false, needPrint:Bool = false, contextData:Dictionary , formats: String...)
```
The **JLConsoleLogLevel** is an enum to sort by different levels. The numbers of warning and error are displayed on option view and bubble.
The **JLConsoleLogCategory** is your business category and is an alias of **String**. You can define your own categories met your demand, such as Video, TrackPage, Commodity Detail... If you need to filter your categories, you must register in this way in your code:
```
let SubPageTestLog:JLConsoleLogCategory = "com.consolelog.mybusiness" //declare a category
JLConsoleController.shared.register(newCategory: SubPageTestLog) //register it
```
The parameter, **contextData**, is a serializable Dictionary. The data will be shown on the detail page in Json.
The parameters, **formats**, is variadic parameters of String. The **first value** will be shown on the cell's title in console.
If **needPrint** equals true, the log information will print in your Xcode console in Debug environment.
Otherwise, JLConsoleController provides a **followingAction** to operate other actions when you finish logging. For example, you can send a track point log to statistics server such as *Firebase* in followingAction closure. Meanwhile, please don't forget to set **hasFollowingAction** as true while you log.
```
JLErrorLog(category: SubPageTestLog, hasFollowingAction: true ,needPrint: true, contextData: ["test":5], formats: "Error!",#function,String(#line))
```
This is an error log example.
---
#### Performance Monitor
JLConsoleLog provides a performance monitor. You can add these to turn on it.
```
JLConsoleController.shared.performanceMonitable = true
```
The git address is
## Requirement
* iOS 12
* Swift 5.2
* Xcode 11
## Reference
[PerformanceMonitor](https://github.com/woshiccm/PerformanceMonitor)
## License
MIT