Ecosyste.ms: Awesome
An open API service indexing awesome lists of open source software.
https://github.com/janpfeifer/gonb-echarts
GoNB ECharts Support
https://github.com/janpfeifer/gonb-echarts
Last synced: 5 days ago
JSON representation
GoNB ECharts Support
- Host: GitHub
- URL: https://github.com/janpfeifer/gonb-echarts
- Owner: janpfeifer
- License: mit
- Created: 2024-04-09T06:22:54.000Z (9 months ago)
- Default Branch: main
- Last Pushed: 2024-04-14T10:05:17.000Z (8 months ago)
- Last Synced: 2024-10-30T06:41:01.671Z (about 2 months ago)
- Language: HTML
- Size: 105 KB
- Stars: 4
- Watchers: 1
- Forks: 1
- Open Issues: 0
-
Metadata Files:
- Readme: README.md
- License: LICENSE
Awesome Lists containing this project
README
# [Apache ECharts](https://echarts.apache.org/en/index.html) for Jupyter Notebooks with Go ([Examples](https://janpfeifer.github.io/gonb-echarts/))
This package adds Go Notebook support to [Apache ECharts](https://echarts.apache.org/en/index.html)
using [GoNB](https://github.com/janpfeifer/gonb) Jupyter kernel and [github.com/go-echarts/go-echarts](https://github.com/go-echarts/go-echarts).
It defines two methods to display [go-echarts](https://github.com/go-echarts/go-echarts) charts: `Display`
that immediately display the chart, and `DisplayContent` that returns the HTML content needed to generate
the chart -- useful for instance if the chart needs to be laid out inside other HTML content.
See included [examples](https://janpfeifer.github.io/gonb-echarts/) -- Notebook file (without the rendered images) in [`examples.ipynb`](https://github.com/janpfeifer/gonb-echarts/blob/main/examples.ipynb).
## Screenshots:
**Note**: being just screenshots these are not animated -- see [examples](https://janpfeifer.github.io/gonb-echarts/) for animated version.
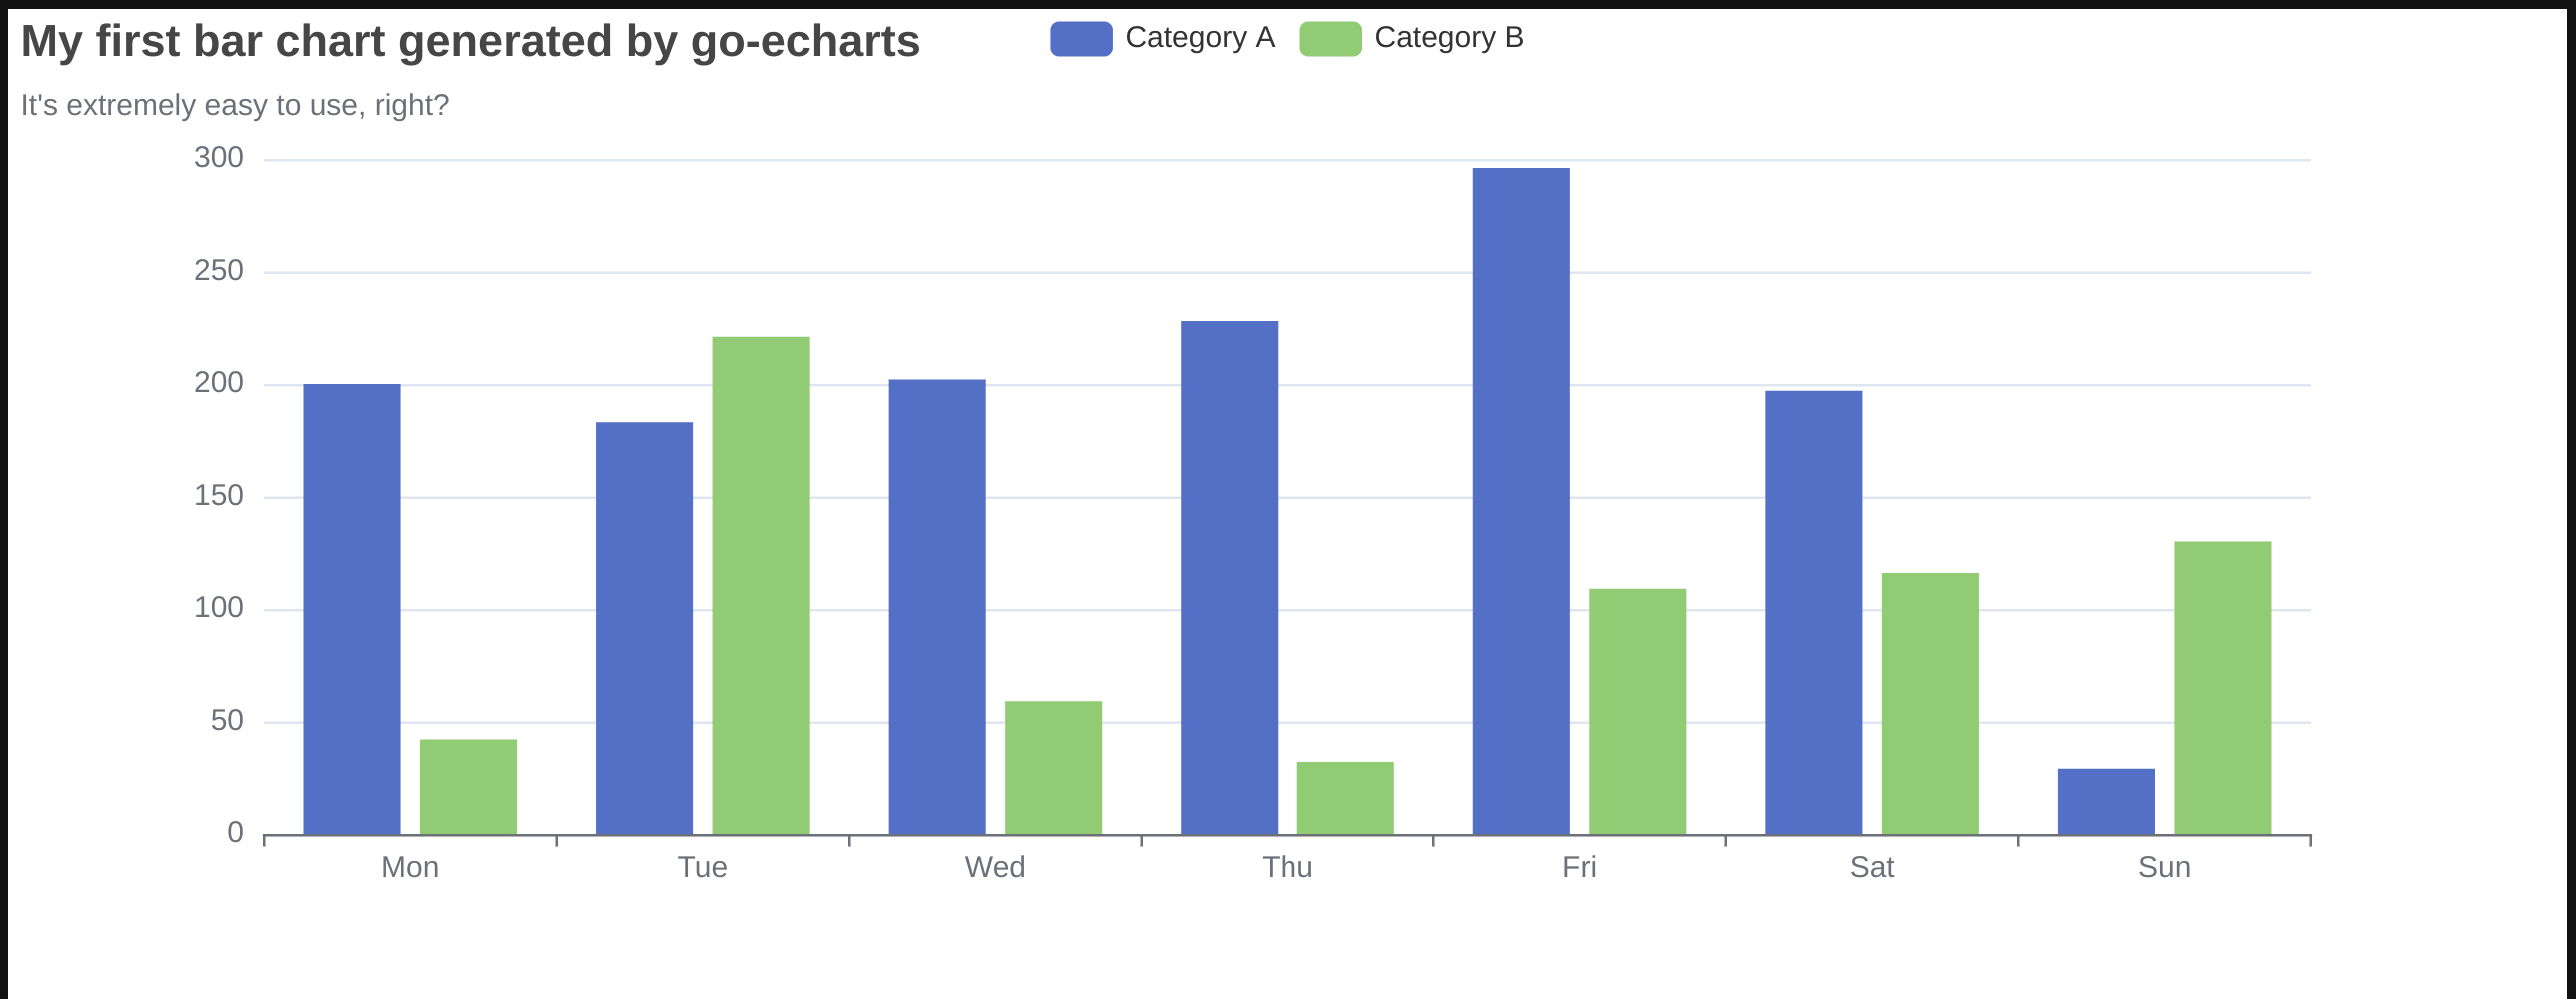
### Bar Chart (with code)
```go
import (
"math/rand"
"github.com/go-echarts/go-echarts/v2/charts"
"github.com/go-echarts/go-echarts/v2/opts"
gonb_echarts "github.com/janpfeifer/gonb-echarts"
)
// generate random data for bar chart
func generateBarItems() []opts.BarData {
items := make([]opts.BarData, 0)
for i := 0; i < 7; i++ {
items = append(items, opts.BarData{Value: rand.Intn(300)})
}
return items
}
%%
bar := charts.NewBar()
// set some global options like Title/Legend/ToolTip or anything else
bar.SetGlobalOptions(charts.WithTitleOpts(opts.Title{
Title: "My first bar chart generated by go-echarts",
Subtitle: "It's extremely easy to use, right?",
}))
// Put data into instance
bar.SetXAxis([]string{"Mon", "Tue", "Wed", "Thu", "Fri", "Sat", "Sun"}).
AddSeries("Category A", generateBarItems()).
AddSeries("Category B", generateBarItems())
// Display
err := gonb_echarts.Display(bar, "width: 1024px; height:400px; background: white;")
if err != nil {
fmt.Printf("Error: %+v\n", err)
}
```

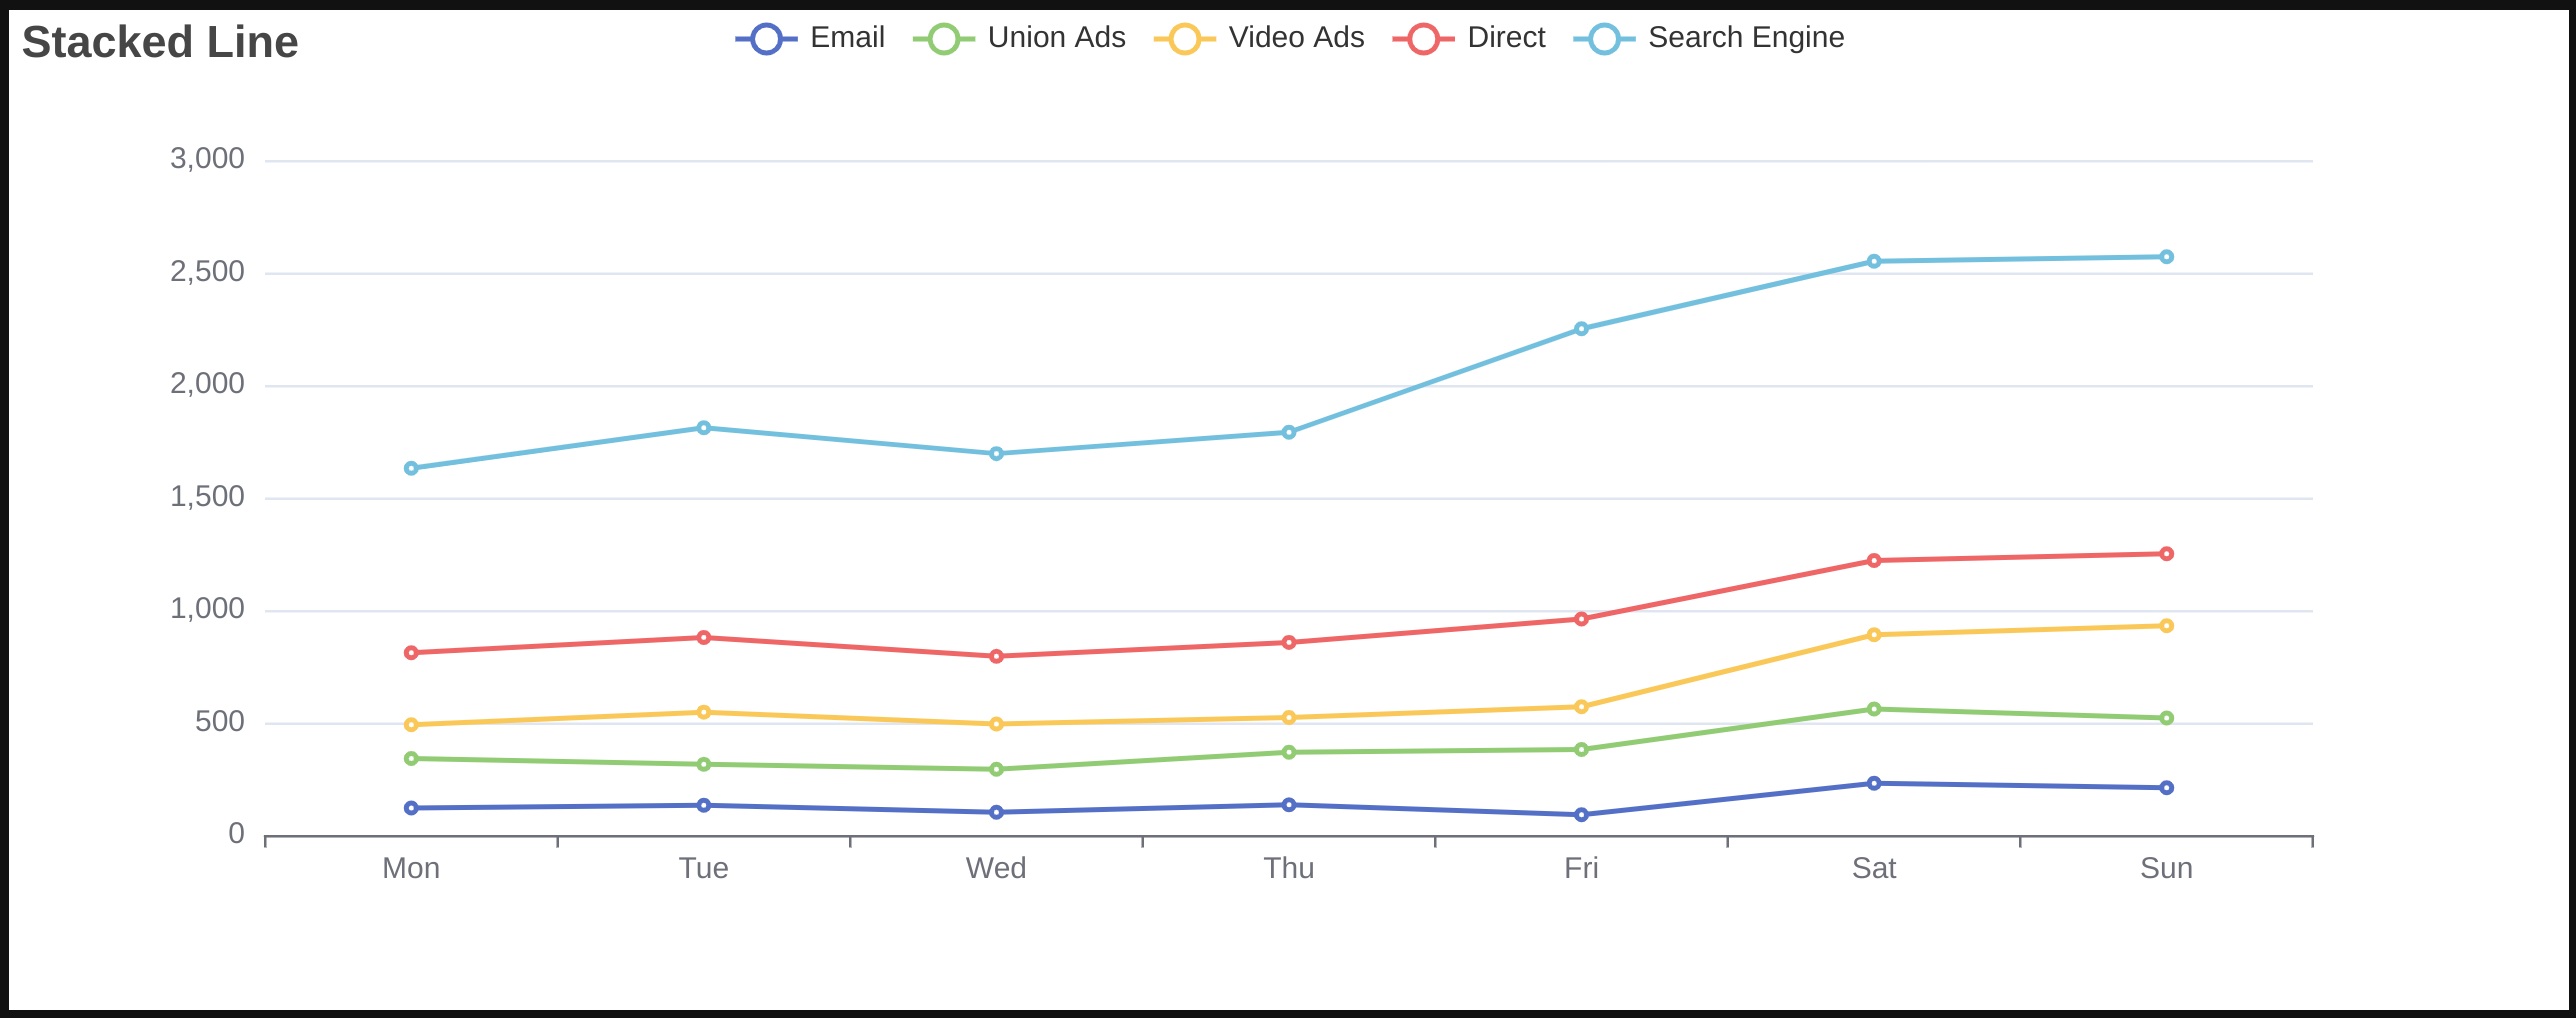
### Stacked Lines

### Geo Map example

## Limitations
Because the charts depend on Javascript, they won't display in GitHub.
But exporting notebooks to HTML using [JupyterLab](https://jupyter.og) will correctly include the charts.
## Issues, feature requests, discussions and support
Please, use [github.com/janpfeifer/gonb](https://github.com/janpfeifer/gonb) repository.