https://github.com/jcmgray/robodraw
An ergonomic and programmatic drawing library for python.
https://github.com/jcmgray/robodraw
diagrams drawing matplotlib
Last synced: about 1 month ago
JSON representation
An ergonomic and programmatic drawing library for python.
- Host: GitHub
- URL: https://github.com/jcmgray/robodraw
- Owner: jcmgray
- License: other
- Created: 2026-05-16T00:30:22.000Z (2 months ago)
- Default Branch: main
- Last Pushed: 2026-05-18T21:52:58.000Z (2 months ago)
- Last Synced: 2026-06-16T02:40:11.553Z (about 1 month ago)
- Topics: diagrams, drawing, matplotlib
- Language: Python
- Homepage: https://robodraw.readthedocs.io
- Size: 4.8 MB
- Stars: 3
- Watchers: 0
- Forks: 0
- Open Issues: 0
-
Metadata Files:
- Readme: README.md
- License: LICENSE
Awesome Lists containing this project
README
[](https://github.com/jcmgray/robodraw/actions/workflows/tests.yml)
[](https://codecov.io/gh/jcmgray/robodraw)
[](https://robodraw.readthedocs.io)
[](https://pypi.org/project/robodraw/)
[](https://anaconda.org/conda-forge/robodraw)
[](https://pixi.sh)
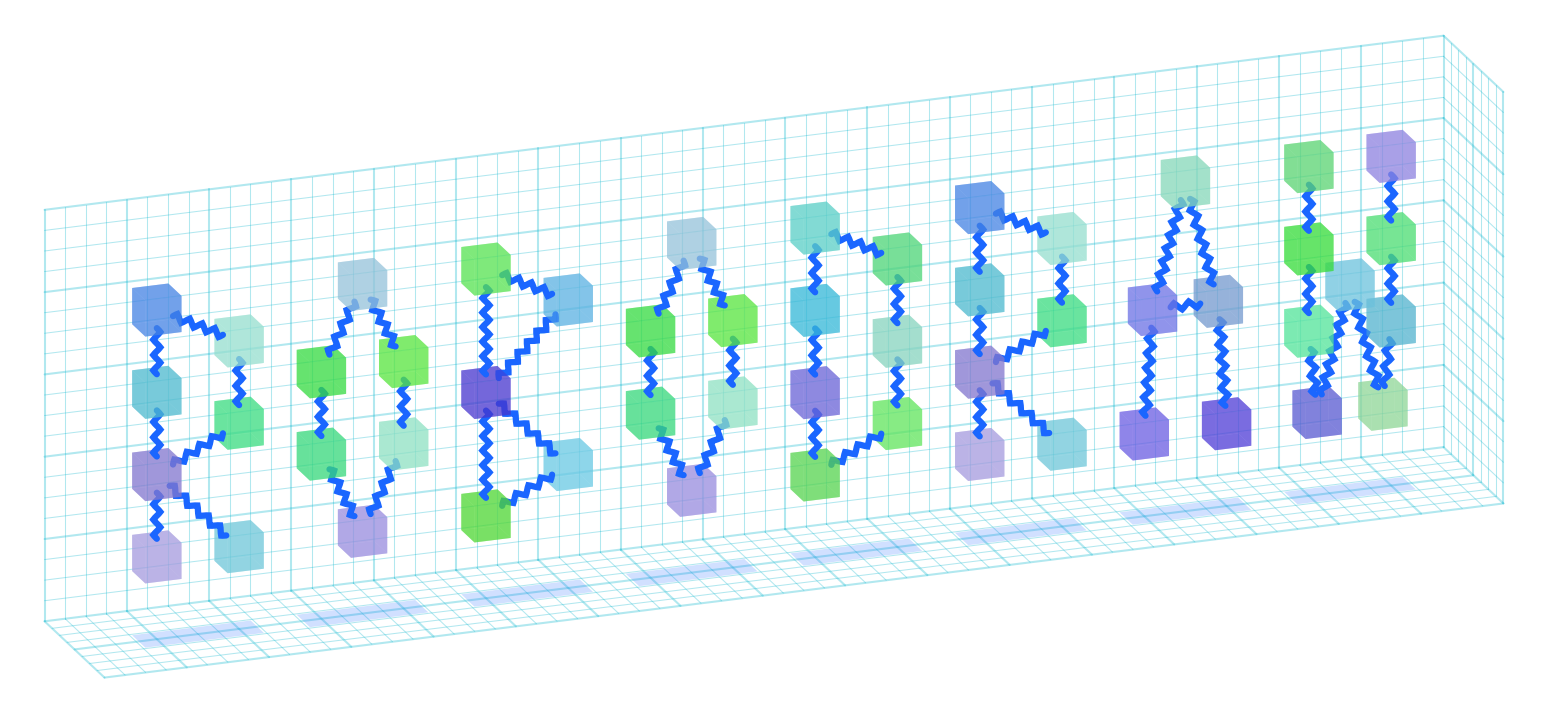
`robodraw` is an ergonomic and programmatic drawing library for python. It is a
wrapper around `matplotlib` that provides a more intuitive way to specifically
create *drawings and diagrams*, including in pseudo-3d. It provides the backend
for the drawing functionality in [`quimb`](https://quimb.readthedocs.io) and
[`cotengra`](https://cotengra.readthedocs.io).
Some useful features include:
- no boilerplate to get a simple drawing.
- plot limits automatically expand to fit all drawn elements.
- style presets: reuse style across elements.
- diagram primitives like `zigzag`, `curve` (draw a smooth line through an
arbitrary set of points exactly), and `patch_around` (draw a smooth shape
highlighting an arbitrary set of points).
- pseudo-3d drawing, with automatic perspective and occlusion handling.
- squared paper grid to help you with placement.
- output or use existing matplotlib figure and axis.
- basic colors tools
- ... and more!
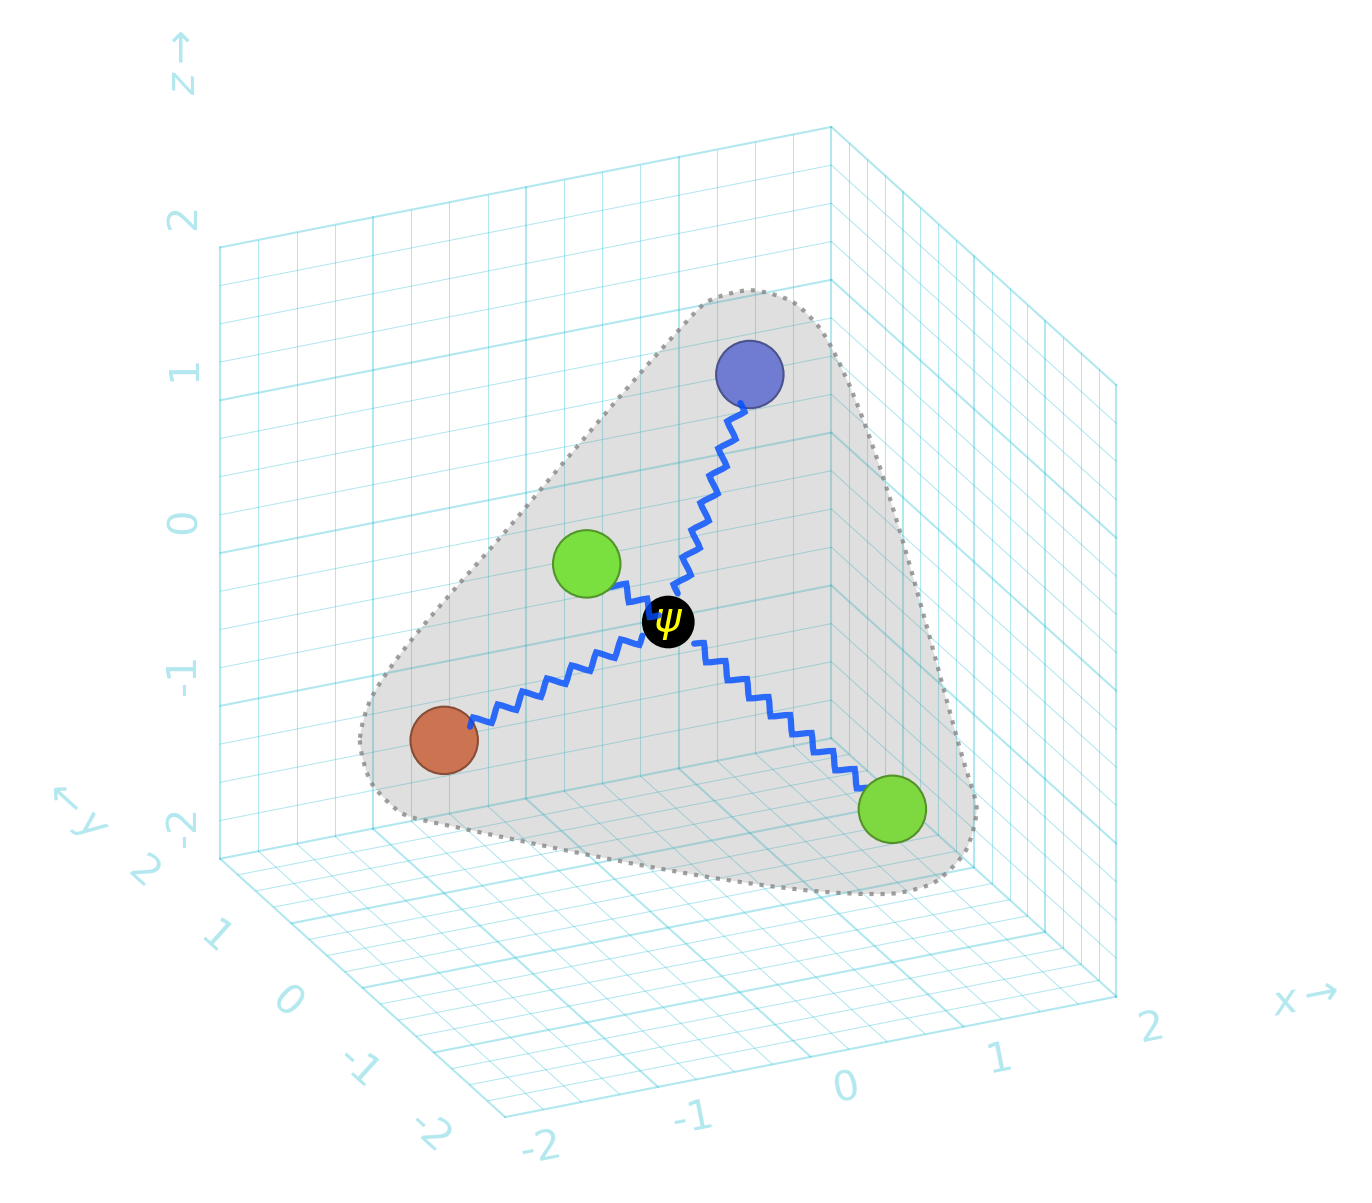
A quick example:
```python
import robodraw
d = robodraw.Drawing(
presets={
"node": {"radius": 0.2, "linewidth": 0.5},
"edge": {"color": (0, 0.3, 1, .8), "width": 0.04, "shorten": 0.2}
},
projection=(25, 25),
)
center = (0, 0, 0)
corners = [(1, 1, 1), (1, -1, -1), (-1, 1, -1), (-1, -1, 1)]
# nodes
for c in corners:
color = robodraw.hash_to_color(str(c))
d.circle(c, preset='node', color=color)
# center
d.circle(center, preset='node', radius=0.15, color="black")
d.text(center, "$\\psi$", color="yellow")
# edges to center
for c in corners:
d.zigzag(c, center, preset="edge")
d.patch_around(corners, radius=0.5)
d.grid3d()
```
The **full documentation** can be found at:
[robodraw.readthedocs.io](https://robodraw.readthedocs.io). Contributions of
any sort are very welcome - please see the
[contributing guide](https://github.com/jcmgray/robodraw/blob/main/.github/CONTRIBUTING.md).
[Issues](https://github.com/jcmgray/robodraw/issues) and
[pull requests](https://github.com/jcmgray/robodraw/pulls) are hosted on
[github](https://github.com/jcmgray/robodraw). For other questions and
suggestions, please use the
[discussions page](https://github.com/jcmgray/robodraw/discussions).