https://github.com/jefworks-lab/scatterbar
Scatterbar - data visualization for proportional data across many spatially resolved coordinates
https://github.com/jefworks-lab/scatterbar
data-visualization spatial-analysis spatial-data-analysis spatial-transcriptomics
Last synced: 8 months ago
JSON representation
Scatterbar - data visualization for proportional data across many spatially resolved coordinates
- Host: GitHub
- URL: https://github.com/jefworks-lab/scatterbar
- Owner: JEFworks-Lab
- License: gpl-3.0
- Created: 2023-08-21T15:49:37.000Z (almost 3 years ago)
- Default Branch: main
- Last Pushed: 2025-03-03T10:14:48.000Z (over 1 year ago)
- Last Synced: 2025-10-22T03:43:57.874Z (8 months ago)
- Topics: data-visualization, spatial-analysis, spatial-data-analysis, spatial-transcriptomics
- Language: R
- Homepage: http://jef.works/scatterbar/
- Size: 13.2 MB
- Stars: 11
- Watchers: 1
- Forks: 1
- Open Issues: 1
-
Metadata Files:
- Readme: README.md
- Changelog: NEWS.md
- License: LICENSE.md
Awesome Lists containing this project
README
# scatterbar
[](https://github.com/JEFworks-Lab/scatterbar/actions/workflows/R-CMD-check.yaml)
[](https://CRAN.R-project.org/package=scatterbar)
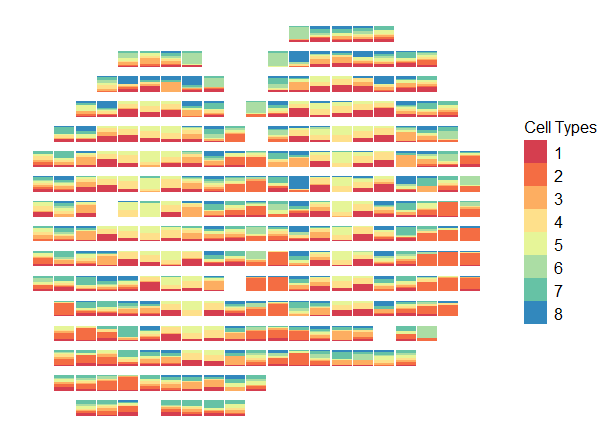
`scatterbar` is an open-source R package for displaying proportional data across spatially resolved contexts. This is the `scatterbar` R documentation
website. Questions, suggestions, or problems should be submitted as
[GitHub issues](https://github.com/JEFworks-Lab/scatterbar/issues).

## Overview
By combining the concepts of scatter plots and stacked bar charts,
`scatterbar` allows users to visualize variations in proportional data
data and compare across different spatial locations.
## Installation
To install `scatterbar`from GitHub, we recommend using `remotes`:
``` r
require(remotes)
remotes::install_github('JEFworks-Lab/scatterbar')
```
## Tutorials
- [Customizing
Scatterbar](https://jef.works/scatterbar/articles/customizing_scatterbar.html)
- [Getting Started With
Scatterbar](https://jef.works/scatterbar/articles/getting-started-with-scatterbars.html)
- [Using Scatterbar With `SpatialExperiment`](https://jef.works/scatterbar/articles/using-scatterbar-with-spatial-experiment.html)
- [Using Scatterbar With Visium Files](https://jef.works/scatterbar/articles/using-scatterbar-with-visium.html)
- [Visualizing Multiple Datasets](https://jef.works/scatterbar/articles/visualizing-multiple-datasets.html)
- [Flipping Scatterbar Oreintations](https://jef.works/scatterbar/articles/flipping-scatterbar-oreintations.html)
## Citation
Our paper describing `scatterbar` is available on *Oxford Bioinformatics*:
[Velazquez D. et al. (2025), "scatterbar: an R package for visualizing proportional data across spatially resolved coordinates", *Bioinformatics*](https://doi.org/10.1093/bioinformatics/btaf047)