https://github.com/jerbouma/financetoolkit
Transparent and Efficient Financial Analysis
https://github.com/jerbouma/financetoolkit
commodities economics equities factor-analysis finance financial-analysis financial-data financial-statements fundamental-analysis fundamentals investing investments market-data openbb options performance-analysis risk-management sector-analysis stock-data technical-analysis
Last synced: about 1 year ago
JSON representation
Transparent and Efficient Financial Analysis
- Host: GitHub
- URL: https://github.com/jerbouma/financetoolkit
- Owner: JerBouma
- License: mit
- Created: 2019-04-08T11:44:25.000Z (over 7 years ago)
- Default Branch: main
- Last Pushed: 2025-04-27T13:21:47.000Z (about 1 year ago)
- Last Synced: 2025-04-27T13:24:00.838Z (about 1 year ago)
- Topics: commodities, economics, equities, factor-analysis, finance, financial-analysis, financial-data, financial-statements, fundamental-analysis, fundamentals, investing, investments, market-data, openbb, options, performance-analysis, risk-management, sector-analysis, stock-data, technical-analysis
- Language: Python
- Homepage: https://www.jeroenbouma.com/projects/financetoolkit
- Size: 231 MB
- Stars: 3,549
- Watchers: 74
- Forks: 413
- Open Issues: 1
-
Metadata Files:
- Readme: README.md
- Contributing: CONTRIBUTING.md
- Funding: .github/FUNDING.yml
- License: LICENSE.txt
Awesome Lists containing this project
README
[](https://github.com/JerBouma/FinanceToolkit)
[](https://github.com/sponsors/JerBouma)
[](https://www.buymeacoffee.com/jerbouma)
[](https://twitter.com/JerBouma)
[](https://www.linkedin.com/in/boumajeroen/)
[](https://www.jeroenbouma.com/projects/financetoolkit/docs)
[](https://pypi.org/project/FinanceToolkit/)
[](https://pypi.org/project/FinanceToolkit/)
[](https://pepy.tech/project/financetoolkit)
While browsing a variety of websites, I repeatedly observed significant fluctuations in the same financial metric among different sources. Similarly, the reported financial statements often didn't line up, and there was limited information on the methodology used to calculate each metric.
For example, Microsoft's Price-to-Earnings (PE) ratio on the 6th of May, 2023 is reported to be 28.93 (Stockopedia), 32.05 (Morningstar), 32.66 (Macrotrends), 33.09 (Finance Charts), 33.66 (Y Charts), 33.67 (Wall Street Journal), 33.80 (Yahoo Finance) and 34.4 (Companies Market Cap). All of these calculations are correct, however the method of calculation varies leading to different results. Therefore, collecting data from multiple sources can lead to wrong interpretation of the results given that one source could apply a different definition than another. And that is, if that definition is even available as often the underlying methods are hidden behind a paid subscription.
**This is why I designed the FinanceToolkit**, this is an open-source toolkit in which all relevant financial ratios ([150+](#available-metrics)), indicators and performance measurements are written down in the most simplistic way allowing for complete transparency of the method of calculation ([proof](https://github.com/JerBouma/FinanceToolkit/blob/main/financetoolkit/ratios/valuation_model.py)). This enables you to avoid dependence on metrics from other providers that do not provide their methods. With a large selection of financial statements in hand, it facilitates streamlined calculations, promoting the adoption of a consistent and universally understood methods and formulas.
The Finance Toolkit not only supports Equities. Even for Options, Currencies, Cryptocurrencies, ETFs, Mutual Funds, Indices, Money Markets, Commodities, Key Economic Indicators and more, the Finance Toolkit can be used to obtain historical data as well as important performance and risk measurements such as the Sharpe Ratio and Value at Risk.
The Finance Toolkit is complimented very well with the [Finance Database 🌎](https://github.com/JerBouma/FinanceDatabase), a database that features 300.000+ symbols containing Equities, ETFs, Funds, Indices, Currencies, Cryptocurrencies and Money Markets. By utilising both, it is possible to do a fully-fledged competitive analysis with the tickers found from the FinanceDatabase inputted into the FinanceToolkit.
---
**Interested in seeing the Finance Toolkit in action?** Find below a dashboard that can plot most of the metrics found inside the Finance Toolkit. **Find the dashboard here.**

---
# Table of Contents
1. [Installation](#installation)
2. [Basic Usage](#basic-usage)
3. [Functionality and Metrics](#core-functionality-and-metrics)
4. [Questions & Answers](#questions--answers)
5. [Contributing](#contributing)
6. [Contact](#contact)
# Installation
Before installation, consider starring the project on GitHub which helps others find the project as well.
To install the FinanceToolkit it simply requires the following:
```
pip install financetoolkit -U
````
Then within Python use:
```python
from financetoolkit import Toolkit
companies = Toolkit(
tickers=['GOOGL', 'MSFT', 'AMZN'],
api_key="FINANCIAL_MODELING_PREP_KEY",
)
```
To be able to get started, you need to obtain an API Key from FinancialModelingPrep. This is used to gain access to 30+ years of financial statement both annually and quarterly. Note that the Free plan is limited to 250 requests each day, 5 years of data and only features companies listed on US exchanges.
___
Obtain an API Key from FinancialModelingPrep here.
___
Through the link you are able to subscribe for the free plan and also premium plans at a **15% discount**. This is an affiliate link and thus supports the project at the same time. I have chosen FinancialModelingPrep as a source as I find it to be the most transparent, reliable and at an affordable price. I have yet to find a platform offering such low prices for the amount of data offered. When you notice that the data is inaccurate or have any other issue related to the data, note that I simply provide the means to access this data and I am not responsible for the accuracy of the data itself. For this, use [their contact form](https://site.financialmodelingprep.com/contact) or provide the data yourself.
The dependencies of the package are on purpose *very slim* so that it will work well with any combination of packages and not result in conflicts. In case you wish to use the Finance Toolkit in combination with Yahoo Finance, you can do so by installing the optional dependency with `pip install "financetoolkit[yfinance]"`.
# Basic Usage
This section is an introduction to the Finance Toolkit. Also see [this notebook](https://www.jeroenbouma.com/projects/financetoolkit/getting-started) for a detailed Getting Started guide as well as [this notebook](https://www.jeroenbouma.com/projects/financetoolkit/finance-database) that includes the [Finance Database 🌎](https://www.jeroenbouma.com/projects/financedatabase) and a proper financial analysis. Next to that, find below a fully-fledged code documentation as well as Jupyter Notebooks in which you can see many examples ranging from basic examples to creating custom ratios to working with your own datasets.
___
Find a variety of How-To Guides including Code Documentation for the FinanceToolkit here.
___
A basic example of how to use the Finance Toolkit is shown below.
````python
from financetoolkit import Toolkit
companies = Toolkit(["AAPL", "MSFT"], api_key=API_KEY, start_date="2017-12-31")
# a Historical example
historical_data = companies.get_historical_data()
# a Financial Statement example
income_statement = companies.get_income_statement()
# a Ratios example
profitability_ratios = companies.ratios.collect_profitability_ratios()
# a Models example
extended_dupont_analysis = companies.models.get_extended_dupont_analysis()
# an Options example
all_greeks = companies.options.collect_all_greeks(expiration_time_range=180)
# a Performance example
factor_asset_correlations = companies.performance.get_factor_asset_correlations(
period="quarterly"
)
# a Risk example
value_at_risk = companies.risk.get_value_at_risk(period="weekly")
# a Technical example
ichimoku_cloud = companies.technicals.get_ichimoku_cloud()
# a Fixed Income example
corporate_bond_yields = companies.fixed_income.get_ice_bofa_effective_yield()
# an Economics example
unemployment_rates = companies.economics.get_unemployment_rate()
````
Generally, the functions return a DataFrame with a multi-index in which all tickers, in this case Apple and Microsoft, are presented. To keep things manageable for this README, I select just Apple but in essence the list of tickers can be endless as I've seen DataFrames with thousands of tickers. The filtering is done through `.loc['AAPL']` and `.xs('AAPL', level=1, axis=1)` based on whether it's fundamental data or historical data respectively.
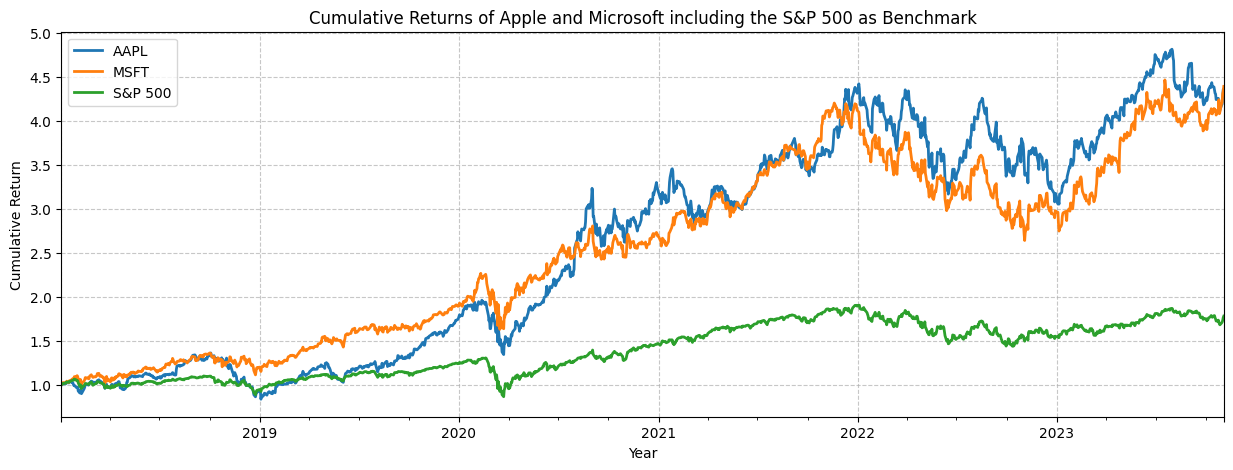
### Obtaining Historical Data
Obtain historical data on a daily, weekly, monthly or yearly basis. This includes OHLC, volumes, dividends, returns, cumulative returns and volatility calculations for each corresponding period. For example, the a portion of the historical data for Apple is shown below.
| date | Open | High | Low | Close | Adj Close | Volume | Dividends | Return | Volatility | Excess Return | Excess Volatility | Cumulative Return |
|:-----------|--------:|--------:|--------:|--------:|------------:|------------:|------------:|---------:|-------------:|----------------:|--------------------:|--------------------:|
| 2018-01-02 | 42.54 | 43.075 | 42.315 | 43.065 | 40.78 | 1.02224e+08 | 0 | 0 | 0.0202 | -0.0067 | 0.0233 | 1 |
| 2018-01-03 | 43.1325 | 43.6375 | 42.99 | 43.0575 | 40.77 | 1.17982e+08 | 0 | -0.0002 | 0.0202 | -0.0247 | 0.0233 | 0.9998 |
| 2018-01-04 | 43.135 | 43.3675 | 43.02 | 43.2575 | 40.96 | 8.97384e+07 | 0 | 0.0047 | 0.0202 | -0.0198 | 0.0233 | 1.0044 |
| 2018-01-05 | 43.36 | 43.8425 | 43.2625 | 43.75 | 41.43 | 9.46401e+07 | 0 | 0.0115 | 0.0202 | -0.0133 | 0.0233 | 1.0159 |
| 2018-01-08 | 43.5875 | 43.9025 | 43.4825 | 43.5875 | 41.27 | 8.22711e+07 | 0 | -0.0039 | 0.0202 | -0.0287 | 0.0233 | 1.012 |
And below the cumulative returns are plotted which include the S&P 500 as benchmark:
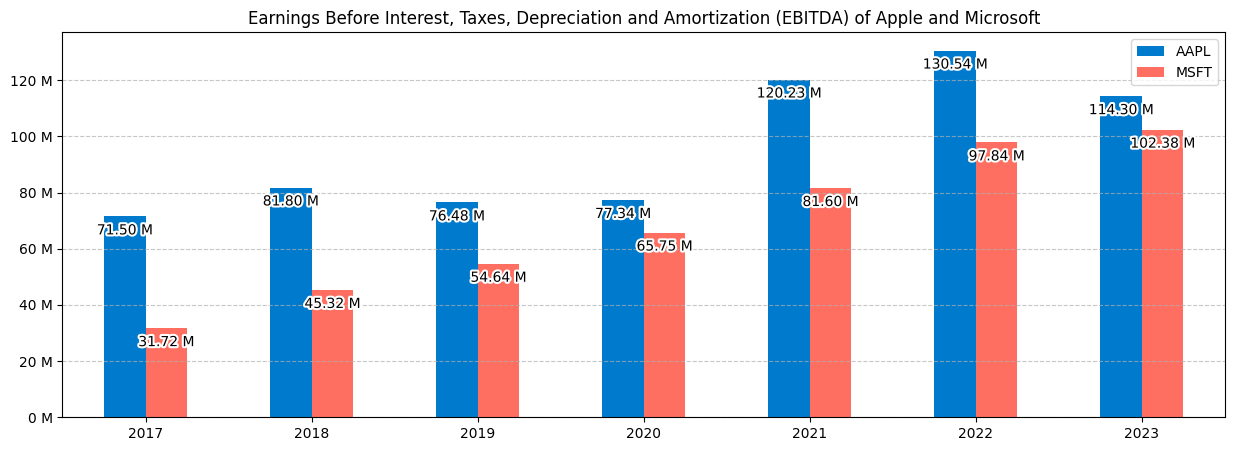
### Obtaining Financial Statements
Obtain an Income Statement on an annual or quarterly basis. This can also be a balance statement (`companies.get_balance_sheet_statement()`) or cash flow statement (`companies.get_cash_flow_statement()`). For example, the first 5 rows of the Income Statement for Apple are shown below.
| | 2017 | 2018 | 2019 | 2020 | 2021 | 2022 | 2023 |
|:----------------------------------|------------:|------------:|------------:|------------:|------------:|------------:|------------:|
| Revenue | 2.29234e+11 | 2.65595e+11 | 2.60174e+11 | 2.74515e+11 | 3.65817e+11 | 3.94328e+11 | 3.83285e+11 |
| Cost of Goods Sold | 1.41048e+11 | 1.63756e+11 | 1.61782e+11 | 1.69559e+11 | 2.12981e+11 | 2.23546e+11 | 2.14137e+11 |
| Gross Profit | 8.8186e+10 | 1.01839e+11 | 9.8392e+10 | 1.04956e+11 | 1.52836e+11 | 1.70782e+11 | 1.69148e+11 |
| Gross Profit Ratio | 0.3847 | 0.3834 | 0.3782 | 0.3823 | 0.4178 | 0.4331 | 0.4413 |
| Research and Development Expenses | 1.1581e+10 | 1.4236e+10 | 1.6217e+10 | 1.8752e+10 | 2.1914e+10 | 2.6251e+10 | 2.9915e+10 |
And below the Earnings Before Interest, Taxes, Depreciation and Amortization (EBITDA) are plotted for both Apple and Microsoft.
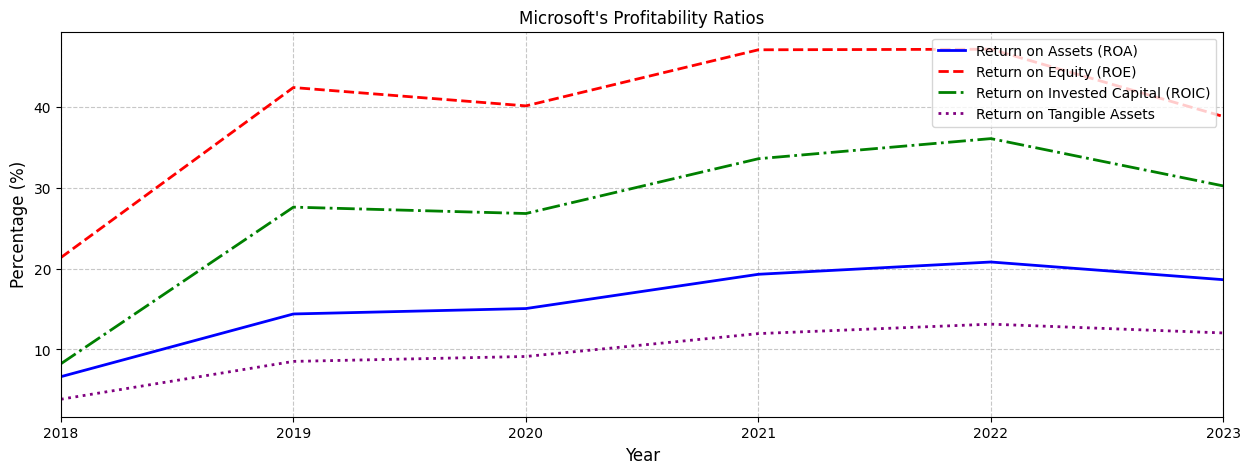
### Obtaining Financial Ratios
Get Profitability Ratios based on the inputted balance sheet, income and cash flow statements. This can be any of the 50+ ratios within the `ratios` module. The `get_` functions show a single ratio whereas the `collect_` functions show an aggregation of multiple ratios. For example, see some of the profitability ratios of Microsoft below.
| | 2017 | 2018 | 2019 | 2020 | 2021 | 2022 | 2023 |
|:--------------------------------|--------:|--------:|--------:|--------:|--------:|--------:|--------:|
| Gross Margin | 0.6191 | 0.6525 | 0.659 | 0.6778 | 0.6893 | 0.684 | 0.6892 |
| Operating Margin | 0.2482 | 0.3177 | 0.3414 | 0.3703 | 0.4159 | 0.4206 | 0.4177 |
| Net Profit Margin | 0.2357 | 0.1502 | 0.3118 | 0.3096 | 0.3645 | 0.3669 | 0.3415 |
| Interest Coverage Ratio | 13.9982 | 16.5821 | 20.3429 | 25.3782 | 34.7835 | 47.4275 | 52.0244 |
| Income Before Tax Profit Margin | 0.2574 | 0.3305 | 0.3472 | 0.3708 | 0.423 | 0.4222 | 0.4214 |
And below a few of the profitability ratios are plotted for Microsoft.
### Obtaining Financial Models
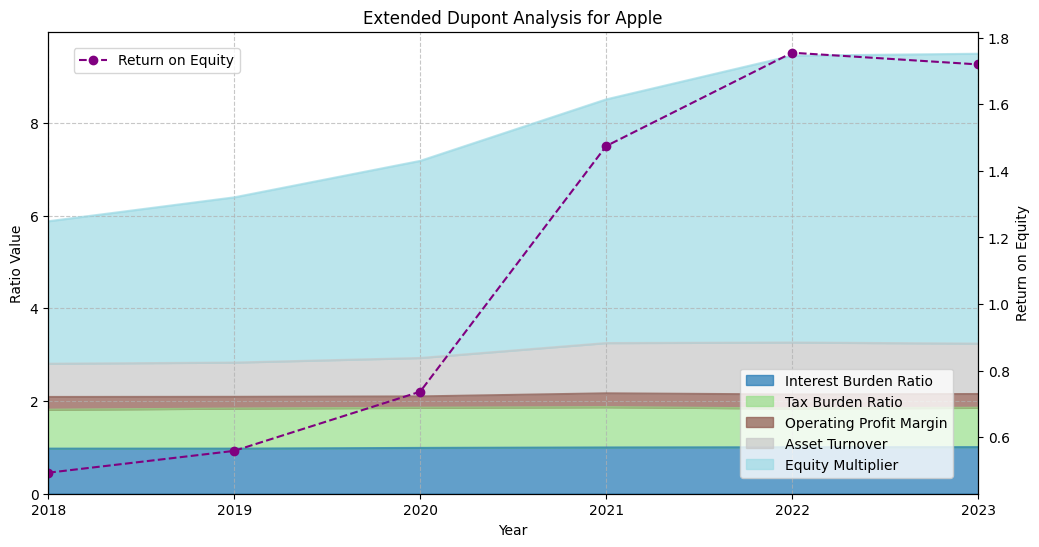
Get an Extended DuPont Analysis based on the inputted balance sheet, income and cash flow statements. This can also be an Enterprise Value Breakdown, Weighted Average Cost of Capital (WACC), Altman Z-Score and many more models. For example, this shows the Extended DuPont Analysis for Apple:
| | 2017 | 2018 | 2019 | 2020 | 2021 | 2022 | 2023 |
|:------------------------|---------:|-------:|-------:|-------:|-------:|-------:|-------:|
| Interest Burden Ratio | 0.9572 | 0.9725 | 0.9725 | 0.988 | 0.9976 | 1.0028 | 1.005 |
| Tax Burden Ratio | 0.7882 | 0.8397 | 0.8643 | 0.8661 | 0.869 | 0.8356 | 0.8486 |
| Operating Profit Margin | 0.2796 | 0.2745 | 0.2527 | 0.2444 | 0.2985 | 0.302 | 0.2967 |
| Asset Turnover | nan | 0.7168 | 0.7389 | 0.8288 | 1.0841 | 1.1206 | 1.0868 |
| Equity Multiplier | nan | 3.0724 | 3.5633 | 4.2509 | 5.255 | 6.1862 | 6.252 |
| Return on Equity | nan | 0.4936 | 0.5592 | 0.7369 | 1.4744 | 1.7546 | 1.7195 |
And below each component of the Extended Dupont Analysis is plotted including the resulting Return on Equity (ROE).
### Obtaining Options and Greeks
Get the Black Scholes Model for both call and put options including the relevant Greeks, in this case Delta, Gamma, Theta and Vega. This can be any of the First, Second or Third Order Greeks as found in the the `options` module. The `get_` functions show a single Greek whereas the `collect_` functions show an aggregation of Greeks. For example, see the delta of the Call options for Apple for multiple expiration times and strike prices below (Stock Price: 185.92, Volatility: 31.59%, Dividend Yield: 0.49% and Risk Free Rate: 3.95%):
| | 1 Month | 2 Months | 3 Months | 4 Months | 5 Months | 6 Months |
|----:|----------:|-----------:|-----------:|-----------:|-----------:|-----------:|
| 175 | 0.7686 | 0.7178 | 0.6967 | 0.6857 | 0.6794 | 0.6759 |
| 180 | 0.6659 | 0.64 | 0.6318 | 0.629 | 0.6285 | 0.6291 |
| 185 | 0.5522 | 0.5583 | 0.5648 | 0.571 | 0.5767 | 0.5816 |
| 190 | 0.4371 | 0.4762 | 0.4977 | 0.513 | 0.5249 | 0.5342 |
| 195 | 0.3298 | 0.3971 | 0.4324 | 0.4562 | 0.474 | 0.4875 |
Which can also be plotted together with Gamma, Theta and Vega as follows:

### Obtaining Performance Metrics
Get the correlations with the factors as defined by Fama-and-French. These include market, size, value, operating profitability and investment. The beauty of all functionality here is that it can be based on any period as the function accepts the period `intraday`, `weekly`, `monthly`, `quarterly` and `yearly`. For example, this shows the quarterly correlations for Apple:
| | Mkt-RF | SMB | HML | RMW | CMA |
|:-------|---------:|--------:|--------:|--------:|--------:|
| 2022Q2 | 0.9177 | -0.1248 | -0.5077 | -0.3202 | -0.2624 |
| 2022Q3 | 0.8092 | 0.1528 | -0.5046 | -0.1997 | -0.5231 |
| 2022Q4 | 0.8998 | 0.2309 | -0.5968 | -0.1868 | -0.5946 |
| 2023Q1 | 0.7737 | 0.1606 | -0.3775 | -0.228 | -0.5707 |
| 2023Q2 | 0.7416 | -0.1166 | -0.2722 | 0.0093 | -0.4745 |
And below the correlations with each factor are plotted over time for both Apple and Microsoft.

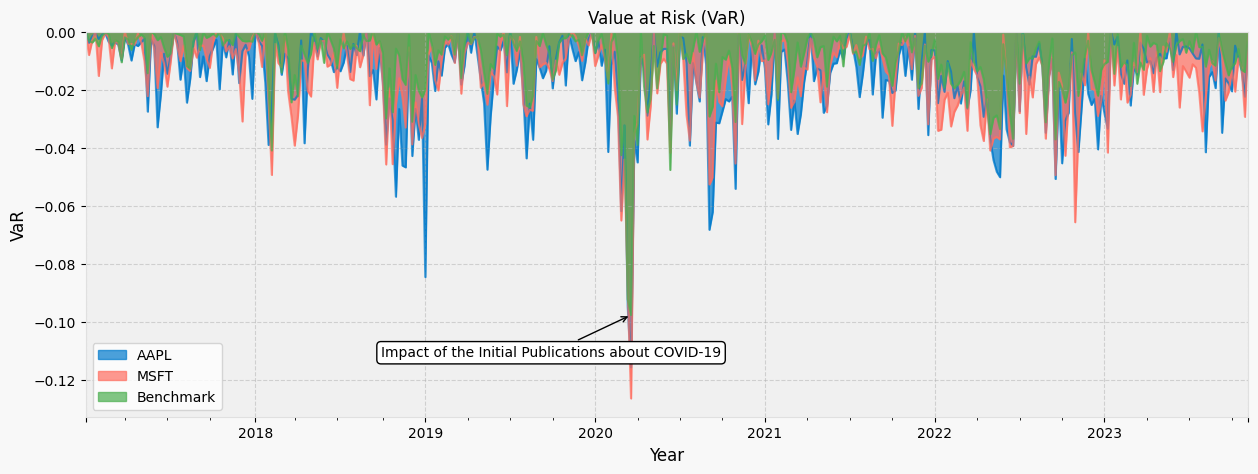
### Obtaining Risk Metrics
Get the Value at Risk for each week. Here, the days within each week are considered for the Value at Risk. This makes it so that you can understand within each period what is the expected Value at Risk (VaR) which can again be any period but also based on distributions such as Historical, Gaussian, Student-t, Cornish-Fisher.
| | AAPL | MSFT | Benchmark |
|:----------------------|--------:|--------:|------------:|
| 2023-09-25/2023-10-01 | -0.0205 | -0.0133 | -0.0122 |
| 2023-10-02/2023-10-08 | -0.0048 | -0.0206 | -0.0108 |
| 2023-10-09/2023-10-15 | -0.0089 | -0.0092 | -0.0059 |
| 2023-10-16/2023-10-22 | -0.0135 | -0.0124 | -0.0131 |
| 2023-10-23/2023-10-29 | -0.0224 | -0.0293 | -0.0139 |
And below the Value at Risk (VaR) for Apple, Microsoft and the benchmark (S&P 500) are plotted also demonstrating the impact of COVID-19.
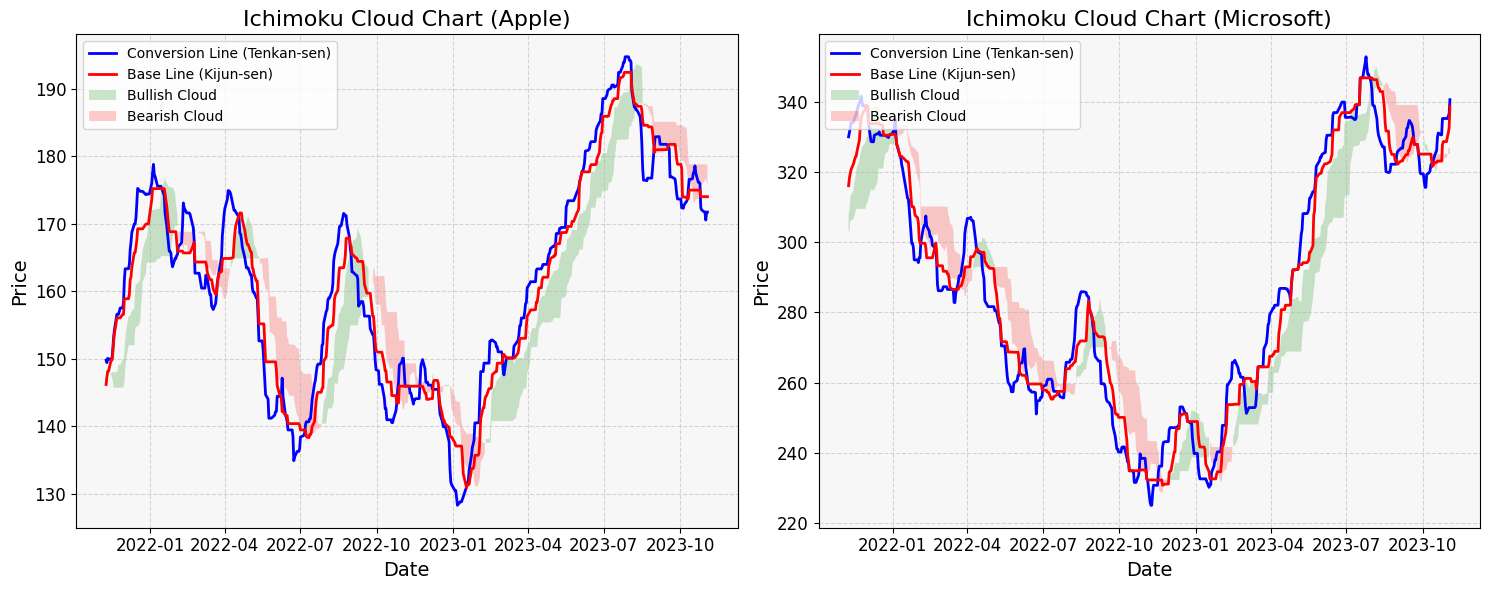
### Obtaining Technical Indicators
Get the Ichimoku Cloud parameters based on the historical market data. This can be any of the 30+ technical indicators within the `technicals` module. The `get_` functions show a single indicator whereas the `collect_` functions show an aggregation of multiple indicators. For example, see some of the parameters for Apple below:
| Date | Base Line | Conversion Line | Leading Span A | Leading Span B |
|:-----------|------------:|------------------:|-----------------:|-----------------:|
| 2023-10-30 | 174.005 | 171.755 | 176.245 | 178.8 |
| 2023-10-31 | 174.005 | 171.755 | 176.37 | 178.8 |
| 2023-11-01 | 174.005 | 170.545 | 176.775 | 178.8 |
| 2023-11-02 | 174.005 | 171.725 | 176.235 | 178.8 |
| 2023-11-03 | 174.005 | 171.725 | 175.558 | 178.8 |
And below the Ichimoku Cloud parameters are plotted for Apple and Microsoft side-by-side.
### Obtaining Fixed Income Metrics
Get access to the ICE BofA Corporate Bond benchmark indices and a variety of other bond and derivative related valuations within the `fixedincome` module. For example, see the Effective Yield for the ICE BofA Corporate Bond Index below for each Credit Rating:
| Date | AAA | AA | A | BBB | BB | B | CCC |
|:-----------|-------:|-------:|-------:|-------:|-------:|-------:|-------:|
| 2024-04-19 | 0.0518 | 0.0532 | 0.0561 | 0.0594 | 0.0678 | 0.0804 | 0.1385 |
| 2024-04-22 | 0.0517 | 0.0532 | 0.056 | 0.0593 | 0.0671 | 0.0793 | 0.1377 |
| 2024-04-23 | 0.0514 | 0.0528 | 0.0556 | 0.0589 | 0.066 | 0.0777 | 0.1364 |
| 2024-04-24 | 0.0518 | 0.0531 | 0.0559 | 0.0592 | 0.0664 | 0.0778 | 0.1361 |
| 2024-04-25 | 0.0524 | 0.0537 | 0.0564 | 0.0598 | 0.0673 | 0.079 | 0.1368 |
And below a variety of Fixed Income metrics are shown all acquired from the Fixed Income module.

### Understanding Key Economic Indicators
Get insights for 60+ countries into key economic indicators such as the Consumer Price Index (CPI), Gross Domestic Product (GDP), Unemployment Rates and 3-month and 10-year Government Interest Rates. This is done through the `economics` module and can be used as a standalone module as well by using `from financetoolkit import Economics`. For example see a selection of the countries below:
| | Colombia | United States | Sweden | Japan | Germany |
|:-----|-----------:|----------------:|---------:|--------:|----------:|
| 2017 | 0.093 | 0.0435 | 0.0686 | 0.0281 | 0.0357 |
| 2018 | 0.0953 | 0.039 | 0.0648 | 0.0244 | 0.0321 |
| 2019 | 0.1037 | 0.0367 | 0.0691 | 0.0235 | 0.0298 |
| 2020 | 0.1586 | 0.0809 | 0.0848 | 0.0278 | 0.0362 |
| 2021 | 0.1381 | 0.0537 | 0.0889 | 0.0282 | 0.0358 |
| 2022 | 0.1122 | 0.0365 | 0.0748 | 0.026 | 0.0307 |
And below these Unemployment Rates are plotted over time:

# Core Functionality and Metrics
The Finance Toolkit has the ability to collect 30+ years of financial statements and calculate 150+ financial metrics. The following list shows all of the available functionality and metrics.
Each ratio and indicator has a corresponding function that can be called directly for example `ratios.get_return_on_equity` or `technicals.get_relative_strength_index`. However, there are also functions that collect multiple ratios or indicators at once such as `ratios.collect_profitability_ratios`. These functions are useful when you want to collect a large amount of ratios or indicators at once.

___
Find a variety of How-To Guides including Code Documentation for the FinanceToolkit here.
___
## Core Functionality
These are the core functionalities of the Finance Toolkit. For any calculation, it often first collects data via these functions. For example, financial ratios require the financial statements and historical data which are obtained through the Toolkit without needing to specify this first.
Financial Statements
Acquire a full history of both annual and quarterly financial statements, including [balance sheets](https://www.jeroenbouma.com/projects/financetoolkit/docs#get_balance_sheet_statement), [income statements](https://www.jeroenbouma.com/projects/financetoolkit/docs#get_income_statement), and [cash flow statements](https://www.jeroenbouma.com/projects/financetoolkit/docs#get_cash_flow_statement).
These financial statements are adjusted for the following reasons:
- The financial statements are automatically standardized (based on [these files](https://github.com/JerBouma/FinanceToolkit/tree/main/financetoolkit/normalization) to allow for the ability to enter any type of dataset given that the names used are what all of the functionalities rely on.
- The fiscal year of each company is automatically converted to the calendar year so that all companies can be compared on the same basis. As an example, Apple's Q4 2023 is related to the period July 2023 until September 2023 which corresponds to Q3 2023. This means that in the Finance Toolkit these results are reported in the Q3 2023 column.
- When `convert_currency=True` (automatically enabled with a Premium FMP plan) the currency of the historical data is compared to the currency of the financial statements. If they do not match, the financial statement data is converted to the currency of the historical data. This is done to ensure that calculations such as the Price-to-Earnings Ratio (PE) have both the Share Price and Earnings denoted in the same currency.
To get insights related to the reported currency, CIK ID and SEC Links, it is possible to retrieve a [statististics statement](https://www.jeroenbouma.com/projects/financetoolkit/docs#get_statistics_statement) as well.
As an example:
```python
from financetoolkit import Toolkit
toolkit = Toolkit(["MSFT", "MU"], api_key="FINANCIAL_MODELING_PREP_KEY", quarterly=True, start_date='2022-05-01')
balance_sheet_statements = toolkit.get_balance_sheet_statement()
balance_sheet_statements.loc['MU']
```
Which returns:
| | 2022Q2 | 2022Q3 | 2022Q4 | 2023Q1 | 2023Q2 |
|:-----------------------------------------|------------:|------------:|------------:|------------:|------------:|
| Cash and Cash Equivalents | 9.157e+09 | 8.262e+09 | 9.574e+09 | 9.798e+09 | 9.298e+09 |
| Short Term Investments | 1.07e+09 | 1.069e+09 | 1.007e+09 | 1.02e+09 | 1.054e+09 |
| Cash and Short Term Investments | 1.0227e+10 | 9.331e+09 | 1.0581e+10 | 1.0818e+10 | 1.0352e+10 |
| Accounts Receivable | 6.229e+09 | 5.13e+09 | 3.318e+09 | 2.278e+09 | 2.429e+09 |
| Inventory | 5.629e+09 | 6.663e+09 | 8.359e+09 | 8.129e+09 | 8.238e+09 |
| Other Current Assets | 6.08e+08 | 6.44e+08 | 6.63e+08 | 6.73e+08 | 7.15e+08 |
| Total Current Assets | 2.2708e+10 | 2.1781e+10 | 2.2921e+10 | 2.1898e+10 | 2.1734e+10 |
| Property, Plant and Equipment | 3.7355e+10 | 3.9227e+10 | 4.0028e+10 | 3.9758e+10 | 3.9382e+10 |
| Goodwill | 1.228e+09 | 1.228e+09 | 1.228e+09 | 1.228e+09 | 1.252e+09 |
| Intangible Assets | 4.15e+08 | 4.21e+08 | 4.28e+08 | 4.1e+08 | 4.1e+08 |
| Long Term Investments | 1.646e+09 | 1.647e+09 | 1.426e+09 | 1.212e+09 | 9.73e+08 |
| Tax Assets | 6.82e+08 | 7.02e+08 | 6.72e+08 | 6.97e+08 | 7.08e+08 |
| Other Fixed Assets | 1.262e+09 | 1.277e+09 | 1.171e+09 | 1.317e+09 | 1.221e+09 |
| Fixed Assets | 4.2588e+10 | 4.4502e+10 | 4.4953e+10 | 4.4622e+10 | 4.3946e+10 |
| Other Assets | 0 | 0 | 0 | 0 | 0 |
| Total Assets | 6.5296e+10 | 6.6283e+10 | 6.7874e+10 | 6.652e+10 | 6.568e+10 |
| Accounts Payable | 2.019e+09 | 2.142e+09 | 1.789e+09 | 1.689e+09 | 1.64e+09 |
| Short Term Debt | 1.07e+08 | 1.03e+08 | 1.71e+08 | 2.37e+08 | 2.59e+08 |
| Tax Payables | 3.82e+08 | 4.2e+08 | 4.19e+08 | 2.41e+08 | 1.48e+08 |
| Deferred Revenue | 0 | 0 | 0 | 0 | -1.64e+09 |
| Other Current Liabilities | 4.883e+09 | 5.294e+09 | 4.565e+09 | 3.329e+09 | 4.845e+09 |
| Total Current Liabilities | 7.009e+09 | 7.539e+09 | 6.525e+09 | 5.255e+09 | 5.104e+09 |
| Long Term Debt | 7.485e+09 | 7.413e+09 | 1.0719e+10 | 1.2647e+10 | 1.3589e+10 |
| Deferred Revenue Non Current | 6.63e+08 | 5.89e+08 | 5.16e+08 | 5.29e+08 | 6.32e+08 |
| Deferred Tax Liabilities | 0 | 0 | 0 | 0 | 0 |
| Other Non Current Liabilities | 8.58e+08 | 8.35e+08 | 8.08e+08 | 8.32e+08 | 9.5e+08 |
| Total Non Current Liabilities | 9.006e+09 | 8.837e+09 | 1.2043e+10 | 1.4008e+10 | 1.5171e+10 |
| Other Liabilities | 0 | 0 | 0 | 0 | 0 |
| Capital Lease Obligations | 6.29e+08 | 6.1e+08 | 6.25e+08 | 6.1e+08 | 6.03e+08 |
| Total Liabilities | 1.6015e+10 | 1.6376e+10 | 1.8568e+10 | 1.9263e+10 | 2.0275e+10 |
| Preferred Stock | 0 | 0 | 0 | 0 | 0 |
| Common Stock | 1.22e+08 | 1.23e+08 | 1.23e+08 | 1.23e+08 | 1.24e+08 |
| Retained Earnings | 4.5916e+10 | 4.7274e+10 | 4.6873e+10 | 4.4426e+10 | 4.2391e+10 |
| Accumulated Other Comprehensive Income | -3.64e+08 | -5.6e+08 | -4.73e+08 | -3.73e+08 | -3.4e+08 |
| Other Total Shareholder Equity | 3.607e+09 | 3.07e+09 | 2.783e+09 | 3.081e+09 | 3.23e+09 |
| Total Shareholder Equity | 4.9281e+10 | 4.9907e+10 | 4.9306e+10 | 4.7257e+10 | 4.5405e+10 |
| Total Equity | 4.9281e+10 | 4.9907e+10 | 4.9306e+10 | 4.7257e+10 | 4.5405e+10 |
| Total Liabilities and Shareholder Equity | 6.5296e+10 | 6.6283e+10 | 6.7874e+10 | 6.652e+10 | 6.568e+10 |
| Minority Interest | 0 | 0 | 0 | 0 | 0 |
| Total Liabilities and Equity | 6.5296e+10 | 6.6283e+10 | 6.7874e+10 | 6.652e+10 | 6.568e+10 |
| Total Investments | 2.716e+09 | 2.716e+09 | 2.433e+09 | 2.232e+09 | 2.027e+09 |
| Total Debt | 7.592e+09 | 7.516e+09 | 1.089e+10 | 1.2884e+10 | 1.3848e+10 |
| Net Debt | -1.565e+09 | -7.46e+08 | 1.316e+09 | 3.086e+09 | 4.55e+09 |
Company Overviews
Obtain the [profile](https://www.jeroenbouma.com/projects/financetoolkit/docs#get_profile) of the specified tickers. These include important metrics such as the beta, market capitalization, currency, isin, industry, and ipo date that give an overall understanding about the company.
As an example:
```python
from financetoolkit import Toolkit
toolkit = Toolkit(["MSFT", "AAPL"], api_key="FINANCIAL_MODELING_PREP_KEY")
toolkit.get_profile()
```
Which returns:
| | MSFT | AAPL |
|:----------------------|:--------------------------|:----------------------|
| Symbol | MSFT | AAPL |
| Price | 316.48 | 174.49 |
| Beta | 0.903706 | 1.286802 |
| Average Volume | 28153120 | 57348456 |
| Market Capitalization | 2353183809372 | 2744500935588 |
| Last Dividend | 2.7199999999999998 | 0.96 |
| Range | 213.43-366.78 | 124.17-198.23 |
| Changes | -0.4 | 0.49 |
| Company Name | Microsoft Corporation | Apple Inc. |
| Currency | USD | USD |
| CIK | 789019 | 320193 |
| ISIN | US5949181045 | US0378331005 |
| CUSIP | 594918104 | 37833100 |
| Exchange | NASDAQ Global Select | NASDAQ Global Select |
| Exchange Short Name | NASDAQ | NASDAQ |
| Industry | Software—Infrastructure | Consumer Electronics |
| Website | https://www.microsoft.com | https://www.apple.com |
| CEO | Mr. Satya Nadella | Mr. Timothy D. Cook |
| Sector | Technology | Technology |
| Country | US | US |
| Full Time Employees | 221000 | 164000 |
| Phone | 425 882 8080 | 408 996 1010 |
| Address | One Microsoft Way | One Apple Park Way |
| City | Redmond | Cupertino |
| State | WA | CA |
| ZIP Code | 98052-6399 | 95014 |
| DCF Difference | 4.56584 | 4.15176 |
| DCF | 243.594 | 150.082 |
| IPO Date | 1986-03-13 | 1980-12-12 |
Get the [quote](https://www.jeroenbouma.com/projects/financetoolkit/docs#get_quote) of the specified tickers. These include important metrics such as the price, changes, day low, day high, year low, year high, market capitalization, volume, average volume, open, previous close, earnings per share (EPS), price to earnings ratio (PE), earnings announcement, shares outstanding and timestamp that give an overall understanding about the company.
As an example:
```python
from financetoolkit import Toolkit
toolkit = Toolkit(["TSLA", "AAPL"], api_key="FINANCIAL_MODELING_PREP_KEY")
toolkit.get_quote()
```
Which returns:
| | TSLA | AAPL |
|:-----------------------|:-----------------------------|:-----------------------------|
| Symbol | TSLA | AAPL |
| Name | Tesla, Inc. | Apple Inc. |
| Price | 215.49 | 174.49 |
| Changes Percentage | -1.7015 | 0.2816 |
| Change | -3.73 | 0.49 |
| Day Low | 212.36 | 171.96 |
| Day High | 217.58 | 175.1 |
| Year High | 313.8 | 198.23 |
| Year Low | 101.81 | 124.17 |
| Market Capitalization | 682995534313 | 2744500935588 |
| Price Average 50 Days | 258.915 | 187.129 |
| Price Average 200 Days | 196.52345 | 161.4698 |
| Exchange | NASDAQ | NASDAQ |
| Volume | 136276584 | 61172150 |
| Average Volume | 133110158 | 57348456 |
| Open | 214.12 | 172.3 |
| Previous Close | 219.22 | 174 |
| EPS | 3.08 | 5.89 |
| PE | 69.96 | 29.62 |
| Earnings Announcement | 2023-10-17T20:00:00.000+0000 | 2023-10-25T10:59:00.000+0000 |
| Shares Outstanding | 3169499904 | 15728700416 |
| Timestamp | 2023-08-18 20:00:00 | 2023-08-18 20:00:01 |
Get the [rating](https://www.jeroenbouma.com/projects/financetoolkit/docs#get_rating) of the specified tickers. These scores and recommendations are categorized as follows:
- An overall rating
- Discounted Cash Flow (DCF)
- Return on Equity (ROE)
- Return on Assets (ROA)
- Debt to Equity (DE)
- Price Earnings (PE)
- Price to Book (PB)
As an example:
```python
from financetoolkit import Toolkit
toolkit = Toolkit(["AMZN", "TSLA"], api_key="FINANCIAL_MODELING_PREP_KEY")
rating = toolkit.get_rating()
rating.loc['AMZN', 'Rating Recommendation'].tail()
```
Which returns:
| date | Rating Recommendation |
|:--------------------|:------------------------|
| 2023-08-01 00:00:00 | Strong Buy |
| 2023-08-02 00:00:00 | Strong Buy |
| 2023-08-03 00:00:00 | Strong Buy |
| 2023-08-04 00:00:00 | Strong Buy |
| 2023-08-07 00:00:00 | Strong Buy |
(Intraday) Historical Market Data
Obtain [historical market data](https://www.jeroenbouma.com/projects/financetoolkit/docs#get_historical_data) for the specified tickers. This contains the following columns:
- Open: The opening price for the period.
- High: The highest price for the period.
- Low: The lowest price for the period.
- Close: The closing price for the period.
- Adj Close: The adjusted closing price for the period.
- Volume: The volume for the period.
- Dividends: The dividends for the period.
- Return: The return for the period.
- Volatility: The volatility for the period.
- Excess Return: The excess return for the period. This is defined as the return minus the a predefined risk free rate. Only calculated when excess_return is True.
- Excess Volatility: The excess volatility for the period. This is defined as the volatility of the excess return. Only calculated when `excess_return` is True.
- Cumulative Return: The cumulative return for the period.
If a benchmark ticker is selected, it also calculates the benchmark ticker together with the results. By default this is set to “SPY” (S&P 500 Index) but can be any ticker. This is relevant for calculations for models such as CAPM, Alpha and Beta.
Important to note is that when an `api_key` is included in the Toolkit initialization that the data collection defaults to FinancialModelingPrep which is a more stable source and utilises your subscription. However, if this is undesired, it can be disabled by setting `historical_source` to `YahooFinance`. If data collection fails from FinancialModelingPrep it automatically reverts back to YahooFinance.
You are able to specify the `period` which can be `daily` (default), `weekly`, `monthly`, `quarterly` or `yearly`.
As an example:
```python
from financetoolkit import Toolkit
toolkit = Toolkit("AAPL", api_key="FINANCIAL_MODELING_PREP_KEY")
toolkit.get_historical_data(period="yearly")
```
Which returns:
| Date | Open | High | Low | Close | Adj Close | Volume | Dividends | Return | Volatility | Excess Return | Excess Volatility | Cumulative Return |
|:-------|---------:|---------:|---------:|---------:|------------:|------------:|------------:|-----------:|-------------:|----------------:|--------------------:|--------------------:|
| 2013 | 19.7918 | 20.0457 | 19.7857 | 20.0364 | 17.5889 | 2.23084e+08 | 0.108929 | 0 | 0.240641 | 0 | 0.244248 | 1 |
| 2014 | 28.205 | 28.2825 | 27.5525 | 27.595 | 24.734 | 1.65614e+08 | 0.461429 | 0.406225 | 0.216574 | 0.384525 | 0.219536 | 1.40623 |
| 2015 | 26.7525 | 26.7575 | 26.205 | 26.315 | 23.9886 | 1.63649e+08 | 0.5075 | -0.0301373 | 0.267373 | -0.0528273 | 0.269845 | 1.36385 |
| 2016 | 29.1625 | 29.3 | 28.8575 | 28.955 | 26.9824 | 1.22345e+08 | 0.5575 | 0.124804 | 0.233383 | 0.100344 | 0.240215 | 1.53406 |
| 2017 | 42.63 | 42.6475 | 42.305 | 42.3075 | 40.0593 | 1.04e+08 | 0.615 | 0.484644 | 0.176058 | 0.460594 | 0.17468 | 2.27753 |
| 2018 | 39.6325 | 39.84 | 39.12 | 39.435 | 37.9 | 1.40014e+08 | 0.705 | -0.0539019 | 0.287421 | -0.0807619 | 0.289905 | 2.15477 |
| 2019 | 72.4825 | 73.42 | 72.38 | 73.4125 | 71.615 | 1.00806e+08 | 0.76 | 0.889578 | 0.261384 | 0.870388 | 0.269945 | 4.0716 |
| 2020 | 134.08 | 134.74 | 131.72 | 132.69 | 130.559 | 9.91166e+07 | 0.8075 | 0.823067 | 0.466497 | 0.813897 | 0.470743 | 7.4228 |
| 2021 | 178.09 | 179.23 | 177.26 | 177.57 | 175.795 | 6.40623e+07 | 0.865 | 0.346482 | 0.251019 | 0.331362 | 0.251429 | 9.99467 |
| 2022 | 128.41 | 129.95 | 127.43 | 129.93 | 129.378 | 7.70342e+07 | 0.91 | -0.264042 | 0.356964 | -0.302832 | 0.377293 | 7.35566 |
| 2023 | 187.84 | 188.51 | 187.68 | 188.108 | 188.108 | 4.72009e+06 | 0.71 | 0.453941 | 0.213359 | 0.412901 | 0.22327 | 10.6947 |
It is also possible to retrieve [intraday data](https://www.jeroenbouma.com/projects/financetoolkit/docs#get_intraday_data). This has the option to get you 1 minute, 5 minute, 15 minute, 30 minute or 1 hour data. It can also be used as part of the Risk, Performance and Technicals modules when defining `intraday_period` as part of the Toolkit initialization.
As an example:
```python
from financetoolkit import Toolkit
toolkit = Toolkit("MSFT", api_key="FINANCIAL_MODELING_PREP_KEY")
toolkit.get_intraday_data(period="1min")
```
Which returns:
| date | Open | High | Low | Close | Volume | Return | Volatility | Cumulative Return |
|:-----------------|-------:|-------:|--------:|--------:|---------:|---------:|-------------:|--------------------:|
| 2024-01-19 15:45 | 397.64 | 397.88 | 397.63 | 397.88 | 49202 | 0.0006 | 0.0005 | 1.0266 |
| 2024-01-19 15:46 | 397.86 | 397.93 | 397.788 | 397.82 | 68913 | -0.0002 | 0.0005 | 1.0264 |
| 2024-01-19 15:47 | 397.81 | 397.97 | 397.76 | 397.78 | 62605 | -0.0001 | 0.0005 | 1.0263 |
| 2024-01-19 15:48 | 397.78 | 397.85 | 397.675 | 397.845 | 62146 | 0.0002 | 0.0005 | 1.0265 |
| 2024-01-19 15:49 | 397.85 | 397.97 | 397.8 | 397.94 | 72700 | 0.0002 | 0.0005 | 1.0267 |
| 2024-01-19 15:50 | 397.92 | 398.27 | 397.9 | 398.04 | 140754 | 0.0003 | 0.0005 | 1.027 |
| 2024-01-19 15:51 | 398.04 | 398.15 | 397.96 | 398 | 122208 | -0.0001 | 0.0005 | 1.0269 |
| 2024-01-19 15:52 | 397.99 | 398.26 | 397.98 | 398.05 | 83546 | 0.0001 | 0.0005 | 1.027 |
| 2024-01-19 15:53 | 398.04 | 398.12 | 397.98 | 398.09 | 85098 | 0.0001 | 0.0005 | 1.0271 |
| 2024-01-19 15:54 | 398.1 | 398.52 | 398.03 | 398.45 | 187358 | 0.0009 | 0.0005 | 1.028 |
| 2024-01-19 15:55 | 398.45 | 398.62 | 398.25 | 398.335 | 237902 | -0.0003 | 0.0005 | 1.0278 |
| 2024-01-19 15:56 | 398.33 | 398.44 | 398.3 | 398.415 | 149157 | 0.0002 | 0.0005 | 1.028 |
| 2024-01-19 15:57 | 398.42 | 398.5 | 398.29 | 398.43 | 181074 | 0 | 0.0005 | 1.028 |
| 2024-01-19 15:58 | 398.46 | 398.47 | 398.29 | 398.35 | 278802 | -0.0002 | 0.0005 | 1.0278 |
| 2024-01-19 15:59 | 398.35 | 398.66 | 398.22 | 398.66 | 586344 | 0.0008 | 0.0005 | 1.0286 |
Treasury Rates
Just like the historical market data, obtain a full history for the [treasury rates](https://www.jeroenbouma.com/projects/financetoolkit/docs#get_treasury_data) which also serve as risk-free rate by default allowing for calculations such as the Sharpe Ratio. This also includes normalization of the data as well as auto-adjustments for missing values. It can also be obtained from both FinancialModelingPrep and Yahoo Finance.
It returns the following columns:
- 13 Week Treasury Bond
- 5 Year Treasury Bond
- 10 Year Treasury Bond
- 30 Year Treasury Bond
By default, the Finance Toolkit uses the 10 Year Treasury Bond as risk-free rate but this can be changed by setting `risk_free_rate` to any of the other treasury rates.
As an example:
```python
from financetoolkit import Toolkit
companies = Toolkit(["AAPL", "MSFT"], api_key="FINANCIAL_MODELING_PREP_KEY", start_date="2023-08-10")
companies.get_treasury_data()
```
Which returns:
| date | 13 Week | 5 Year | 10 Year | 30 Year |
|:-----------|----------:|---------:|----------:|----------:|
| 2023-10-16 | 0.0533 | 0.0472 | 0.0471 | 0.0487 |
| 2023-10-17 | 0.0534 | 0.0487 | 0.0485 | 0.0495 |
| 2023-10-18 | 0.0533 | 0.0492 | 0.049 | 0.05 |
| 2023-10-19 | 0.0531 | 0.0496 | 0.0499 | 0.051 |
| 2023-10-20 | 0.053 | 0.0491 | 0.0496 | 0.0512 |
Earnings & Dividend Calendars
Obtain [Earnings Calendars](https://www.jeroenbouma.com/projects/financetoolkit/docs#get_earnings_calendar) for any range of companies. You have the option to obtain the actual dates or to convert to the corresponding quarters and can obtain a rich history. This returns:
- Date: The date of the earnings release.
- EPS: The actual earnings-per-share.
- EPS Estimate: The estimated earnings-per-share.
- Revenue: The actual revenue.
- Revenue Estimate: The estimated revenue.
As an example:
```python
from financetoolkit import Toolkit
toolkit = Toolkit(
["AAPL", "MSFT", "GOOGL", "AMZN"], api_key="FINANCIAL_MODELING_PREP_KEY", start_date="2022-08-01", quarterly=False
)
earning_calendar = toolkit.get_earnings_calendar()
earning_calendar.loc['AMZN']
```
Which returns:
| date | EPS | Estimated EPS | Revenue | Estimated Revenue | Fiscal Date Ending | Time |
|:------------|-------:|----------------:|--------------:|--------------------:|:---------------------|:-------|
| 2022-10-27 | 0.17 | 0.22 | 1.27101e+11 | nan | 2022-09-30 | amc |
| 2023-02-02 | 0.25 | 0.18 | 1.49204e+11 | 1.5515e+11 | 2022-12-31 | amc |
| 2023-04-27 | 0.31 | 0.21 | 1.27358e+11 | 1.24551e+11 | 2023-03-31 | amc |
| 2023-08-03 | 0.65 | 0.35 | 1.34383e+11 | 1.19573e+11 | 2023-06-30 | amc |
| 2023-10-25 | nan | 0.56 | nan | 1.41407e+11 | 2023-09-30 | amc |
| 2024-01-31 | nan | nan | nan | nan | 2023-12-30 | amc |
| 2024-04-25 | nan | nan | nan | nan | 2024-03-30 | amc |
| 2024-08-01 | nan | nan | nan | nan | 2024-06-30 | amc |
Furthermore, find [Dividend Calendars](https://www.jeroenbouma.com/projects/financetoolkit/docs#get_dividend_calendar) which includes:
- Date: The date of the dividend.
- Adj Dividend: The adjusted dividend amount.
- Dividend: The dividend amount.
- Record Date: The record date of the dividend.
- Payment Date: The payment date of the dividend.
- Declaration Date: The declaration date of the dividend.
As an example:
```python
from financetoolkit import Toolkit
toolkit = Toolkit(
["AAPL", "MSFT", "GOOGL", "AMZN"], api_key="FINANCIAL_MODELING_PREP_KEY", start_date="2022-08-01", quarterly=False
)
dividend_calendar = toolkit.get_dividend_calendar()
dividend_calendar.loc['AAPL']
```
Which returns:
| date | Adj Dividend | Dividend | Record Date | Payment Date | Declaration Date |
|:-----------|---------------:|-----------:|:--------------|:---------------|:-------------------|
| 2022-08-05 | 0.23 | 0.23 | 2022-08-08 | 2022-08-11 | 2022-07-28 |
| 2022-11-04 | 0.23 | 0.23 | 2022-11-07 | 2022-11-10 | 2022-10-27 |
| 2023-02-10 | 0.23 | 0.23 | 2022-12-28 | 2023-02-16 | 2022-12-19 |
| 2023-05-12 | 0.24 | 0.24 | 2023-05-15 | 2023-05-18 | 2023-05-04 |
| 2023-08-11 | 0.24 | 0.24 | 2023-08-14 | 2023-08-17 | 2023-08-03 |
Analyst Estimates
Obtain the [Analyst Estimates](https://www.jeroenbouma.com/projects/financetoolkit/docs#get_analyst_estimates) which include estimates for Revenue, Earnings-per-Share (EPS), EBITDA, EBIT, Net Income, and SGA Expense from the past and future from a large collection of analysts.
It includes the lower, average and upper bound for each estimate which gives insights whether analysts have reached a consensus on the prices or think wildly different. The larger the difference between the lower and upper bound, the more uncertain the analysts are.
As an example:
```python
from financetoolkit import Toolkit
toolkit = Toolkit(
["AAPL", "MSFT", "GOOGL", "AMZN"], api_key="FINANCIAL_MODELING_PREP_KEY", start_date="2021-05-01", quarterly=False
)
analyst_estimates = toolkit.get_analyst_estimates()
analyst_estimates.loc['AAPL']
```
Which returns:
| | 2021 | 2022 | 2023 | 2024 |
|:------------------------------|-------------:|-------------:|-------------:|-------------:|
| Estimated Revenue Low | 2.98738e+11 | 3.07919e+11 | 3.3871e+11 | 2.93633e+11 |
| Estimated Revenue High | 4.48107e+11 | 4.61878e+11 | 5.08066e+11 | 4.4045e+11 |
| Estimated Revenue Average | 3.73422e+11 | 3.84898e+11 | 4.23388e+11 | 3.67042e+11 |
| Estimated EBITDA Low | 8.50991e+10 | 1.00742e+11 | 1.10816e+11 | 1.07415e+11 |
| Estimated EBITDA High | 1.27649e+11 | 1.51113e+11 | 1.66224e+11 | 1.61122e+11 |
| Estimated EBITDA Average | 1.06374e+11 | 1.25928e+11 | 1.3852e+11 | 1.34269e+11 |
| Estimated EBIT Low | 7.62213e+10 | 9.05428e+10 | 9.9597e+10 | 9.81566e+10 |
| Estimated EBIT High | 1.14332e+11 | 1.35814e+11 | 1.49396e+11 | 1.47235e+11 |
| Estimated EBIT Average | 9.52766e+10 | 1.13178e+11 | 1.24496e+11 | 1.22696e+11 |
| Estimated Net Income Low | 6.54258e+10 | 7.62265e+10 | 8.38492e+10 | 8.23371e+10 |
| Estimated Net Income High | 9.81387e+10 | 1.1434e+11 | 1.25774e+11 | 1.23506e+11 |
| Estimated Net Income Average | 8.17822e+10 | 9.52832e+10 | 1.04811e+11 | 1.02921e+11 |
| Estimated SGA Expense Low | 1.48491e+10 | 1.85317e+10 | 2.03848e+10 | 2.04857e+10 |
| Estimated SGA Expense High | 2.22737e+10 | 2.77975e+10 | 3.05772e+10 | 3.07286e+10 |
| Estimated SGA Expense Average | 1.85614e+10 | 2.31646e+10 | 2.5481e+10 | 2.56072e+10 |
| Estimated EPS Average | 4.26 | 5.465 | 6.01 | 6.2612 |
| Estimated EPS High | 5.12 | 6.56 | 7.21 | 7.5135 |
| Estimated EPS Low | 3.4 | 4.37 | 4.81 | 5.009 |
| Number of Analysts | 14 | 16 | 12 | 10 |
Revenue Segmentations
Retrieve the [product revenue segmentation](https://www.jeroenbouma.com/projects/financetoolkit/docs#get_revenue_product_segmentationPermalink) for each company. This is for example iPhone, iPad, Mac, Wearables, Services, and Other Products for Apple and helps understand the products that grow the fastest and slowest.
As an example:
```python
from financetoolkit import Toolkit
toolkit = Toolkit(
["AAPL", "MSFT", "GOOGL", "AMZN"], api_key="FINANCIAL_MODELING_PREP_KEY", start_date="2021-05-01", quarterly=False
)
product_segmentation = toolkit.get_revenue_product_segmentation()
product_segmentation.loc['MSFT']
```
Which returns:
| | 2022Q2 | 2022Q3 | 2022Q4 | 2023Q1 | 2023Q2 |
|:-----------------------------------|-----------:|-----------:|-----------:|-----------:|------------:|
| Devices | 1.581e+09 | 1.448e+09 | 1.43e+09 | 1.282e+09 | 1.361e+09 |
| Enterprise Services | 1.902e+09 | 1.876e+09 | 1.862e+09 | 2.007e+09 | 1.977e+09 |
| Gaming | 3.455e+09 | 3.61e+09 | 4.758e+09 | 3.607e+09 | 3.491e+09 |
| Linked In Corporation | 3.712e+09 | 3.663e+09 | 3.876e+09 | 3.697e+09 | 3.909e+09 |
| Office Products And Cloud Services | 1.1639e+10 | 1.1548e+10 | 1.1837e+10 | 1.2438e+10 | 1.2905e+10 |
| Other Products And Services | 1.403e+09 | 1.348e+09 | 1.359e+09 | 1.428e+09 | -3.924e+09 |
| Search And News Advertising | 2.926e+09 | 2.928e+09 | 3.223e+09 | 3.045e+09 | 3.012e+09 |
| Server Products And Cloud Services | 1.8839e+10 | 1.8388e+10 | 1.9594e+10 | 2.0025e+10 | 2.1963e+10 |
| Windows | 6.408e+09 | 5.313e+09 | 4.808e+09 | 5.328e+09 | 6.058e+09 |
It is also possible to retrieve the [geographic revenue segmentation](https://www.jeroenbouma.com/projects/financetoolkit/docs#get_revenue_geographic_segmentation) which includes regions such as Americas, Europe, Greater China, Japan, and Rest of Asia Pacific and helps understand where companies retrieve their revenue from. As an example, a company like Microsoft might be based in the United States, their revenue streams are truly global.
As an example:
```python
from financetoolkit import Toolkit
toolkit = Toolkit(
["AAPL", "MSFT", "GOOGL", "AMZN"], api_key="FINANCIAL_MODELING_PREP_KEY", start_date="2021-05-01", quarterly=False
)
geographic_segmentation = toolkit.get_revenue_geographic_segmentation()
geographic_segmentation.loc['AAPL']
```
Which returns:
| | 2020 | 2021 | 2022 | 2023 |
|:-------------|-----------:|-----------:|-----------:|-----------:|
| Americas | 4.631e+10 | 5.1496e+10 | 4.9278e+10 | 3.5383e+10 |
| Asia Pacific | 8.225e+09 | 9.81e+09 | 9.535e+09 | 5.63e+09 |
| China | 2.1313e+10 | 2.5783e+10 | 2.3905e+10 | 1.5758e+10 |
| Europe | 2.7306e+10 | 2.9749e+10 | 2.7681e+10 | 2.0205e+10 |
| Japan | 8.285e+09 | 7.107e+09 | 6.755e+09 | 4.821e+09 |
ESG Scores
[ESG scores](https://www.jeroenbouma.com/projects/financetoolkit/docs#get_esg_scores), which stands for Environmental, Social, and Governance scores, are a crucial metric used by investors and organizations to assess a company’s sustainability and ethical practices. These scores provide valuable insights into a company’s performance in three key areas:
- Environmental (E): The environmental component evaluates a company’s impact on the planet and its efforts to mitigate environmental risks. It includes factors like carbon emissions, energy efficiency, water management, and waste reduction. A high environmental score indicates a company’s commitment to eco-friendly practices and reducing its ecological footprint.
- Social (S): The social component focuses on how a company interacts with its employees, customers, suppliers, and the communities in which it operates. Key factors in the social score include labor practices, diversity and inclusion, human rights, product safety, and community engagement. A strong social score reflects a company’s dedication to fostering positive relationships and contributing positively to society.
- Governance (G): Governance examines a company’s internal structures, policies, and leadership. It assesses aspects such as board independence, executive compensation, transparency, and the presence of anti-corruption measures. A high governance score signifies strong leadership and a commitment to maintaining high ethical standards and accountability
ESG scores provide investors with a holistic view of a company’s sustainability and ethical practices, allowing them to make more informed investment decisions. These scores are increasingly used to identify socially responsible investments and guide capital towards companies that prioritize long-term sustainability and responsible business practices. As the importance of ESG considerations continues to grow, companies are motivated to improve their ESG scores, not only for ethical reasons but also to attract investors who value sustainable and responsible business practices.
As an example:
```python
from financetoolkit import Toolkit
toolkit = Toolkit(
["MSFT", "TSLA", "AMZN"], api_key="FINANCIAL_MODELING_PREP_KEY", start_date="2022-08-01", quarterly=False
)
esg_scores = toolkit.get_esg_scores()
esg_scores.xs("MSFT", level=1, axis=1)
```
Which returns:
| date | Environmental Score | Social Score | Governance Score | ESG Score |
|:-------|----------------------:|---------------:|-------------------:|------------:|
| 2022Q3 | 72.42 | 58.39 | 61.13 | 63.98 |
| 2022Q4 | 72.22 | 58.05 | 61.27 | 63.85 |
| 2023Q1 | 72.6 | 58.74 | 61.88 | 64.41 |
| 2023Q2 | 73.54 | 60.73 | 63.44 | 65.9 |
## Discover Instruments
The Discovery module contains lists of companies, cryptocurrencies, forex, commodities, etfs and indices including screeners, quotes, performance metrics and more to find and select tickers to use in the Finance Toolkit. **Find the Notebook [here](https://www.jeroenbouma.com/projects/financetoolkit/discovery-module) and the documentation [here](https://www.jeroenbouma.com/projects/financetoolkit/docs/discovery) which includes an explanation about the functionality, the parameters and an example.**
Companies
Screen stocks, obtain a list of companies, quotes, floating shares, sectors performance, biggest gainers, biggest losers, most active stocks and delisted companies.
> **Search Instruments**
The search instruments function allows you to search for a company or financial instrument by name. It returns a dataframe with all the symbols that match the query. Find the documentation [here](https://www.jeroenbouma.com/projects/financetoolkit/docs/discovery#search_instruments).
As an example:
```python
from financetoolkit import Discovery
discovery = Discovery(api_key="FINANCIAL_MODELING_PREP_KEY")
discovery.search_instruments(query='META')
```
Which returns:
| Symbol | Name | Currency | Exchange | Exchange Code |
|:---------|:--------------------------------------|:-----------|:-----------------------|:----------------|
| META | Meta Platforms, Inc. | USD | NASDAQ Global Select | NASDAQ |
| META.L | WisdomTree Industrial Metals Enhanced | USD | London Stock Exchange | LSE |
| METAUSD | Metadium USD | USD | CCC | CRYPTO |
| META.MI | WisdomTree Industrial Metals Enhanced | EUR | Milan | MIL |
| META.JK | PT Nusantara Infrastructure Tbk | IDR | Jakarta Stock Exchange | JKT |
> **Stock Screener**
Screen stocks based on a set of criteria. This can be useful to find companies that match a specific criteria or your analysis. Further filtering can be done by utilising the Finance Toolkit and calculating the relevant ratios to filter by. This can be:
- Market capitalization (market_cap_higher, market_cap_lower)
- Price (price_higher, price_lower)
- Beta (beta_higher, beta_lower)
- Volume (volume_higher, volume_lower)
- Dividend (dividend_higher, dividend_lower)
Note that the limit is 1000 companies. Thus if you hit the 1000, it is recommended to narrow down your search to prevent companies from being excluded simply because of this limit. Find the documentation [here](https://www.jeroenbouma.com/projects/financetoolkit/docs/discovery#get_stock_screener).
As an example:
```python
from financetoolkit import Discovery
discovery = Discovery(api_key="FINANCIAL_MODELING_PREP_KEY")
discovery.get_stock_screener(
market_cap_higher=1000000,
market_cap_lower=200000000000,
price_higher=100,
price_lower=200,
beta_higher=1,
beta_lower=1.5,
volume_higher=100000,
volume_lower=2000000,
dividend_higher=1,
dividend_lower=2,
is_etf=False
)
```
Which returns:
| Symbol | Name | Market Cap | Sector | Industry | Beta | Price | Dividend | Volume | Exchange | Exchange Code | Country |
|:---------|:------------------|-------------:|:------------------|:-----------------------|-------:|--------:|-----------:|---------:|:------------------------|:----------------|:----------|
| NKE | NIKE, Inc. | 163403295604 | Consumer Cyclical | Footwear & Accessories | 1.079 | 107.36 | 1.48 | 1045865 | New York Stock Exchange | NYSE | US |
| SAF.PA | Safran SA | 66234006559 | Industrials | Aerospace & Defense | 1.339 | 160.16 | 1.35 | 119394 | Paris | EURONEXT | FR |
| ROST | Ross Stores, Inc. | 46724188589 | Consumer Cyclical | Apparel Retail | 1.026 | 138.785 | 1.34 | 169879 | NASDAQ Global Select | NASDAQ | US |
| HES | Hess Corporation | 44694706090 | Energy | Oil & Gas E&P | 1.464 | 145.51 | 1.75 | 123147 | New York Stock Exchange | NYSE | US |
> **Company List**
The stock list function returns a complete list of all the symbols that can be used in the FinanceToolkit. These are over 60.000 symbols. Find the documentation [here](https://www.jeroenbouma.com/projects/financetoolkit/docs/discovery#get_stock_list).
As an example:
```python
from financetoolkit import Discovery
discovery = Discovery(api_key="FINANCIAL_MODELING_PREP_KEY")
stock_list = discovery.get_stock_list()
# The total list equals over 60.000 rows
stock_list.iloc[38000:38010]
```
Which returns:
| Symbol | Name | Price | Exchange | Exchange Code |
|:------------|:-----------------------------|--------:|:--------------------------------|:----------------|
| LEO.V | Lion Copper and Gold Corp. | 0.09 | Toronto Stock Exchange Ventures | TSX |
| LEOF.TA | Lewinsky-Ofer Ltd. | 263.1 | Tel Aviv | TLV |
| LEON | Leone Asset Management, Inc. | 0.066 | Other OTC | OTC |
| LEON.SW | Leonteq AG | 34.35 | Swiss Exchange | SIX |
| LER.AX | Leaf Resources Limited | 0.014 | Australian Securities Exchange | ASX |
| LERTHAI.BO | LERTHAI FINANCE LIMITED | 265 | Bombay Stock Exchange | BSE |
| LES.WA | Less S.A. | 0.22 | Warsaw Stock Exchange | WSE |
| LESAF | Le Saunda Holdings Limited | 0.071 | Other OTC | PNK |
| LESHAIND.BO | Lesha Industries Limited | 4.68 | Bombay Stock Exchange | BSE |
| LESL | Leslie's, Inc. | 6.91 | NASDAQ Global Select | NASDAQ |
> **Company Quotes**
Returns the real time stock prices for each company. This includes the bid and ask size, the volume, the bid and ask price, the last sales price and the last sales size. Find the documentation [here](https://www.jeroenbouma.com/projects/financetoolkit/docs/discovery#get_stock_quotes).
As an example:
```python
from financetoolkit import Discovery
discovery = Discovery(api_key="FINANCIAL_MODELING_PREP_KEY")
stock_quotes = discovery.get_stock_quotes()
stock_quotes.iloc[3000:3010]
```
Which returns:
| Symbol | Bid Size | Ask Price | Volume | Ask Size | Bid Price | Last Sale Price | Last Sale Size | Last Sale Time |
|:---------|----------:|------------:|-----------------:|-----------:|------------:|------------------:|-----------------:|-----------------:|
| EIPX | 0 | 0 | 59676 | 0 | 0 | 21.28 | 0 | 1.7039e+12 |
| EIRL | 2 | 64.67 | 5455 | 2 | 57.7 | 61.1316 | 0 | 1.7039e+12 |
| EIS | 10 | 61.71 | 15886 | 2 | 56.2 | 58.1909 | 0 | 1.7039e+12 |
| EIX | 1 | 75.7 | 1.41398e+06 | 1 | 50.1 | 71.49 | 0 | 1.70389e+12 |
| EJAN | 1 | 31.42 | 252595 | 1 | 28.1 | 28.67 | 0 | 1.7039e+12 |
| EJH | 6 | 3.83 | 0 | 8 | 3.82 | 3.82 | 100 | 1.7042e+12 |
| EJUL | 2 | 27.97 | 10226 | 2 | 23.16 | 23.63 | 0 | 1.7039e+12 |
| EKG | 4 | 20 | 1197 | 1 | 6.38 | 15.9357 | 0 | 1.70388e+12 |
| EKSO | 3 | 2.54 | 0 | 5 | 2.31 | 2.31 | 100 | 1.7042e+12 |
| EL | 1 | 143.9 | 0 | 1 | 142.5 | 143 | 100 | 1.7042e+12 |
> **Floating Shares**
Returns the shares float for each company. The shares float is the number of shares available for trading for each company. It also includes the number of shares outstanding and the date. Find the documentation [here](https://www.jeroenbouma.com/projects/financetoolkit/docs/discovery#get_stock_shares_float).
As an example:
```python
from financetoolkit import Discovery
discovery = Discovery(api_key="FINANCIAL_MODELING_PREP_KEY")
shares_float = discovery.get_stock_shares_float()
shares_float.iloc[50000:50010]
```
Which returns:
| Symbol | Date | Free Float | Float Shares | Outstanding Shares |
|:---------|:--------------------|-------------:|---------------:|---------------------:|
| OPY.AX | NaT | 51.4746 | 119853548 | 2.3284e+08 |
| OPYGY | NaT | 4.49504 | 60892047 | 1.35465e+09 |
| OQAL | 2024-01-01 13:12:23 | 0 | 0 | 226543 |
| OQLGF | 2023-12-31 21:48:07 | 0.6765 | 1150607 | 1.70082e+08 |
| OR | 2024-01-02 05:18:03 | 99.3281 | 183921869 | 1.85166e+08 |
| OR-R.BK | 2024-01-01 05:29:30 | 23.153 | 2778360000 | 1.2e+10 |
| OR.BK | 2024-01-02 03:52:39 | 22.7847 | 2734164000 | 1.2e+10 |
| OR.PA | 2024-01-02 07:57:35 | 45.2727 | 242084445 | 5.34725e+08 |
| OR.SW | 2023-12-31 13:38:10 | 45.2727 | 355743960 | 7.8578e+08 |
| OR.TO | 2023-12-31 17:56:33 | 99.3317 | 183928535 | 1.85166e+08 |
> **Sectors Performance**
Returns the sectors performance for each sector. This features the sector performance over the last months. Find the documentation [here](https://www.jeroenbouma.com/projects/financetoolkit/docs/discovery#get_sectors_performance).
As an example:
```python
from financetoolkit import Discovery
discovery = Discovery(api_key="FINANCIAL_MODELING_PREP_KEY")
sectors_performance = discovery.get_sectors_performance()
sectors_performance.tail()
```
Which returns:
| Date | Utilities | Basic Materials | Communication Services | Consumer Cyclical | Consumer Defensive | Energy | Financial Services | Healthcare | Industrials | Real Estate | Technology |
|:-----------|------------:|------------------:|-------------------------:|--------------------:|---------------------:|---------:|---------------------:|-------------:|--------------:|--------------:|-------------:|
| 2023-12-27 | 0.13511 | 0.40986 | -0.23963 | 0.10358 | 0.48048 | -0.27499 | 0.30153 | 0.75715 | 0.30234 | 0.35946 | 0.02372 |
| 2023-12-28 | 0.80513 | -0.45131 | -0.15858 | -0.45874 | 0.03828 | -0.81641 | 0.02954 | -0.01345 | 0.22808 | 0.59612 | -0.15283 |
| 2023-12-29 | -0.01347 | -0.14525 | -0.15072 | -0.58879 | 0.18141 | -0.42463 | -0.34718 | -0.082 | -0.2181 | -0.52222 | -0.57062 |
| 2024-01-01 | -0.01347 | -0.14536 | -0.15074 | -0.58877 | 0.18141 | -0.41917 | -0.34753 | -0.08193 | -0.21821 | -0.52216 | -0.5708 |
| 2024-01-02 | -0.01347 | -0.14536 | -0.15074 | -0.58877 | 0.18141 | -0.41917 | -0.34779 | -0.08193 | -0.21823 | -0.52281 | -0.57073 |
> **Biggest Gainers**
Returns the biggest gainers for the day. This includes the symbol, the name, the price, the change and the change percentage. Find the documentation [here](https://www.jeroenbouma.com/projects/financetoolkit/docs/discovery#get_biggest_gainers).
As an example:
```python
from financetoolkit import Discovery
discovery = Discovery(api_key="FINANCIAL_MODELING_PREP_KEY")
biggest_gainers = discovery.get_biggest_gainers()
biggest_gainers.head(10)
```
Which returns:
| Symbol | Name | Change | Price | Change % |
|:---------|:-------------------------------------------------------|---------:|--------:|-----------:|
| AAME | Atlantic American Corporation | 0.3001 | 2.4501 | 13.9581 |
| ADAP | Adaptimmune Therapeutics plc | 0.1029 | 0.793 | 14.9109 |
| ADTX | Aditxt, Inc. | 1.81 | 6.63 | 37.5519 |
| AFMD | Affimed N.V. | 0.0861 | 0.625 | 15.977 |
| AIH | Aesthetic Medical International Holdings Group Limited | 0.1016 | 0.6896 | 17.2789 |
| ANTE | AirNet Technology Inc. | 0.1229 | 0.8299 | 17.3833 |
| APRE | Aprea Therapeutics, Inc. | 1.04 | 4.7 | 28.4153 |
| ASTR | Astra Space, Inc. | 0.55 | 2.28 | 31.7919 |
| BHG | Bright Health Group, Inc. | 2.37 | 7.63 | 45.057 |
| BROG | Brooge Energy Limited | 0.73 | 3.68 | 24.7458 |
> **Biggest Losers**
Returns the biggest losers for the day. This includes the symbol, the name, the price, the change and the change percentage. Find the documentation [here](https://www.jeroenbouma.com/projects/financetoolkit/docs/discovery#get_biggest_losers).
As an example:
```python
from financetoolkit import Discovery
discovery = Discovery(api_key="FINANCIAL_MODELING_PREP_KEY")
biggest_losers = discovery.get_biggest_losers()
biggest_losers.head(10)
```
Which returns:
| Symbol | Name | Change | Price | Change % |
|:---------|:-------------------------------------------|---------:|--------:|-----------:|
| AGAE | Allied Gaming & Entertainment Inc. | -0.2 | 1.06 | -15.873 |
| AVTX | Avalo Therapeutics, Inc. | -2.7339 | 9.1 | -23.1023 |
| BAYAR | Bayview Acquisition Corp Right | -0.03 | 0.12 | -20 |
| BBLG | Bone Biologics Corporation | -1.48 | 4.52 | -24.6667 |
| BKYI | BIO-key International, Inc. | -0.6 | 3 | -16.6667 |
| BREA | Brera Holdings PLC Class B Ordinary Shares | -0.2064 | 0.6112 | -25.2446 |
| BTBT | Bit Digital, Inc. | -0.86 | 4.23 | -16.8959 |
| BTCS | BTCS Inc. | -0.69 | 1.63 | -29.7414 |
| BTDR | Bitdeer Technologies Group | -3.36 | 9.86 | -25.416 |
| BYN | Banyan Acquisition Corporation | -2.035 | 10.9 | -15.7325 |
> **Most Active**
Returns the most active stocks for the day. This includes the symbol, the name, the price, the change and the change percentage. Find the documentation [here](https://www.jeroenbouma.com/projects/financetoolkit/docs/discovery#get_most_active_stocks).
As an example:
```python
from financetoolkit import Discovery
discovery = Discovery(api_key="FINANCIAL_MODELING_PREP_KEY")
most_active_stocks = discovery.get_most_active_stocks()
most_active_stocks.head(10)
```
Which returns:
| Symbol | Name | Change | Price | Change % |
|:---------|:-------------------------------|---------:|--------:|-----------:|
| AAPL | Apple Inc. | -1.05 | 192.53 | -0.5424 |
| ADTX | Aditxt, Inc. | 1.81 | 6.63 | 37.5519 |
| AMD | Advanced Micro Devices, Inc. | -1.35 | 147.41 | -0.9075 |
| AMZN | Amazon.com, Inc. | -1.44 | 151.94 | -0.9388 |
| BAC | Bank of America Corporation | -0.21 | 33.67 | -0.6198 |
| BITF | Bitfarms Ltd. | -0.41 | 2.91 | -12.3494 |
| BITO | ProShares Bitcoin Strategy ETF | -0.33 | 20.49 | -1.585 |
| CAN | Canaan Inc. | -0.5 | 2.31 | -17.7936 |
| CLSK | CleanSpark, Inc. | -2.08 | 11.03 | -15.8657 |
| DISH | DISH Network Corporation | 0.11 | 5.77 | 1.9435 |
> **Delisted Companies**
The delisted stocks function returns a complete list of all delisted stocks including the IPO and delisted date. Find the documentation [here](https://www.jeroenbouma.com/projects/financetoolkit/docs/discovery#get_delisted_stocks).
As an example:
```python
from financetoolkit import Discovery
discovery = Discovery(api_key="FINANCIAL_MODELING_PREP_KEY")
delisted_stocks = discovery.get_delisted_stocks()
delisted_stocks.head(10)
```
Which returns:
| Symbol | Name | Exchange | IPO Date | Delisted Date |
|:---------|:---------------------------------------------|:-----------|:-----------|:----------------|
| AAIC | Arlington Asset Investment Corp. | NYSE | 1997-12-23 | 2023-12-14 |
| ABCM | Abcam plc | NASDAQ | 2010-12-03 | 2023-12-12 |
| ADZ | DB Agriculture Short ETN | AMEX | 2008-04-16 | 2023-10-27 |
| AENZ | Aenza S.A.A. | NYSE | 2013-07-24 | 2023-12-08 |
| AKUMQ | Akumin Inc | NASDAQ | 2018-03-08 | 2023-10-25 |
| ALTMW | Kinetik Holdings Inc - Warrants (09/11/2023) | NASDAQ | 2017-05-01 | 2023-11-07 |
| ARCE | Arco Platform Limited | NASDAQ | 2018-09-26 | 2023-12-07 |
| ARTEW | Artemis Strategic Investment Corporation | NASDAQ | 2021-11-22 | 2023-11-03 |
| ASPAU | Abri SPAC I, Inc. | NASDAQ | 2021-08-10 | 2023-11-02 |
| AVID | Avid Technology, Inc. | NASDAQ | 1993-03-12 | 2023-11-07 |
Cryptocurrencies
Obtain cryptocurrency lists and cryptocurrency quotes that can be used in the Finance Toolkit.
> **Cryptocurrency List**
The crypto list function returns a complete list of all crypto symbols that can be used in the FinanceToolkit. These are over 4.000 symbols. Find the documentation [here](https://www.jeroenbouma.com/projects/financetoolkit/docs/discovery#get_crypto_list).
As an example:
```python
from financetoolkit import Discovery
discovery = Discovery(api_key="FINANCIAL_MODELING_PREP_KEY")
crypto_list = discovery.get_crypto_list()
crypto_list.head(10)
```
Which returns:
| Symbol | Name | Currency | Exchange |
|:-------------|:-------------------------------------|:-----------|:-----------|
| .ALPHAUSD | .Alpha USD | USD | CCC |
| 00USD | 00 Token USD | USD | CCC |
| 0NEUSD | Stone USD | USD | CCC |
| 0X0USD | 0x0.ai USD | USD | CCC |
| 0X1USD | 0x1.tools: AI Multi-tool Plaform USD | USD | CCC |
| 0XAUSD | 0xApe USD | USD | CCC |
| 0XBTCUSD | 0xBitcoin USD | USD | CCC |
| 0XENCRYPTUSD | Encryption AI USD | USD | CCC |
| 0XGASUSD | 0xGasless USD | USD | CCC |
| 0XMRUSD | 0xMonero USD | USD | CCC |
> **Cryptocurrency Quotes**
Returns the quotes for each crypto. This includes the symbol, the name, the price, the change, the change percentage, day low, day high, year high, year low, market cap, 50 day average, 200 day average, volume, average volume, open, previous close, EPS, PE, earnings announcement, shares outstanding and the timestamp. Find the documentation [here](https://www.jeroenbouma.com/projects/financetoolkit/docs/discovery#get_crypto_quotes).
As an example:
```python
from financetoolkit import Discovery
discovery = Discovery(api_key="FINANCIAL_MODELING_PREP_KEY")
crypto_quotes = discovery.get_crypto_quotes()
crypto_quotes.head(10)
```
Which returns:
| Symbol | Name | Price | Change % | Change | Day Low | Day High | Year High | Year Low | Market Cap | 50 Day Avg | 200 Day Avg | Volume | Avg Volume | Open | Previous Close | EPS | PE | Earnings Announcement | Shares Outstanding | Timestamp |
|:-------------|:-------------------------------------|-------------:|-----------:|-------------:|-------------:|------------:|------------:|-------------:|-----------------:|-------------:|--------------:|------------:|-----------------:|------------:|-----------------:|------:|-----:|------------------------:|---------------------:|:--------------------|
| .ALPHAUSD | .Alpha USD | 21.4023 | 0 | 0 | 21.3991 | 21.4023 | 193.252 | 21.4023 | 0 | 23.7774 | 51.0497 | 30 | 162 | 21.4023 | 21.4023 | nan | nan | nan | nan | 2022-10-10 23:28:00 |
| 00USD | 00 Token USD | 0.082484 | 0.67363 | 0.00055192 | 0.0808863 | 0.0857288 | 0.28559 | 0.062939 | 0 | 0.0853295 | 0.0824169 | 210396 | 235403 | 0.0819321 | 0.0819321 | nan | nan | nan | 0 | 2024-01-02 14:05:40 |
| 0NEUSD | Stone USD | 7.39e-10 | -1.70872 | -1.3e-11 | 7.37e-10 | 7.79e-10 | 7.76e-10 | 7.52e-10 | 0 | 0 | 0 | 1110.14 | nan | 7.52e-10 | 7.52e-10 | nan | nan | nan | 0 | 2024-01-02 14:05:12 |
| 0X0USD | 0x0.ai USD | 0.15383 | 4.3101 | 0.00635643 | 0.14748 | 0.1551 | 0.17925 | 0.000275 | 1.33615e+08 | 0.12582 | 0.0734378 | 805257 | 1.17131e+06 | 0.14748 | 0.14748 | nan | nan | nan | 8.68563e+08 | 2024-01-02 14:05:13 |
| 0X1USD | 0x1.tools: AI Multi-tool Plaform USD | 0.00596268 | 2.65558 | 0.000154248 | 0.00580843 | 0.00608836 | 0.48504 | 0.005089 | 0 | 0.00587516 | 0.0448096 | 42.9976 | 216 | 0.00580843 | 0.00580843 | nan | nan | nan | 0 | 2024-01-02 14:06:00 |
| 0XAUSD | 0xApe USD | 9.86177e-06 | -99.9921 | -0.12519 | 9.86177e-06 | 0.12527 | 0.12527 | 9.86177e-06 | 0 | 1.08846e-05 | 1.08846e-05 | 197 | nan | 0.1252 | 0.1252 | nan | nan | nan | nan | 2023-06-24 18:30:00 |
| 0XBTCUSD | 0xBitcoin USD | 0.097478 | 0.6003 | 0.00058167 | 0.0944255 | 0.10393 | 4.13419 | 0.03222 | 946195 | 0.17478 | 0.39561 | 344.45 | 97856 | 0.0968963 | 0.0968963 | nan | nan | nan | 9.70675e+06 | 2024-01-02 14:05:24 |
| 0XENCRYPTUSD | Encryption AI USD | 0.0213021 | 0 | 0 | 0.0213021 | 0.0213021 | 15.4064 | 0.020326 | 0 | 1.55438 | 3.26515 | 2 | 202458 | 0.0213021 | 0.0213021 | nan | nan | nan | nan | 2023-07-26 18:30:00 |
| 0XGASUSD | 0xGasless USD | 0.11228 | 12.1894 | 0.0121997 | 0.10008 | 0.11228 | 0.19216 | 3.7e-05 | 0 | 0.038569 | 0.0143848 | 8700 | 9628 | 0.10008 | 0.10008 | nan | nan | nan | 0 | 2024-01-02 14:06:00 |
| 0XMRUSD | 0xMonero USD | 0.0497938 | -38.9213 | -0.0317302 | 0.0496646 | 2.79013 | 0.18734 | 0.0418889 | 0 | 0.13616 | 0.11633 | 347.276 | 11 | 0.081524 | 0.081524 | nan | nan | nan | nan | 2024-01-02 14:05:07 |
Forex
Obtain forex lists and forex quotes that can be used in the Finance Toolkit.
> **Forex List**
The forex list function returns a complete list of all forex symbols that can be used in the FinanceToolkit. These are over 1.000 symbols. Find the documentation [here](https://www.jeroenbouma.com/projects/financetoolkit/docs/discovery#get_forex_list).
As an example:
```python
from financetoolkit import Discovery
discovery = Discovery(api_key="FINANCIAL_MODELING_PREP_KEY")
forex_list = discovery.get_forex_list()
forex_list.head(10)
```
Which returns:
| Symbol | Name | Currency | Exchange |
|:---------|:--------|:-----------|:-----------|
| AEDAUD | AED/AUD | AUD | CCY |
| AEDBHD | AED/BHD | BHD | CCY |
| AEDCAD | AED/CAD | CAD | CCY |
| AEDCHF | AED/CHF | CHF | CCY |
| AEDDKK | AED/DKK | DKK | CCY |
| AEDEUR | AED/EUR | EUR | CCY |
| AEDGBP | AED/GBP | GBP | CCY |
| AEDILS | AED/ILS | ILS | CCY |
| AEDINR | AED/INR | INR | CCY |
| AEDJOD | AED/JOD | JOD | CCY |
> **Forex Quotes**
Returns the quotes for each forex. This includes the symbol, the name, the price, the change, the change percentage, day low, day high, year high, year low, market cap, 50 day average, 200 day average, volume, average volume, open, previous close, EPS, PE, earnings announcement, shares outstanding and the timestamp. Find the documentation [here](https://www.jeroenbouma.com/projects/financetoolkit/docs/discovery#get_forex_quotes).
As an example:
```python
from financetoolkit import Discovery
discovery = Discovery(api_key="FINANCIAL_MODELING_PREP_KEY")
forex_quotes = discovery.get_forex_quotes()
forex_quotes.head(10)
```
Which returns:
| Symbol | Name | Price | Change % | Change | Day Low | Day High | Year High | Year Low | 50 Day Avg | 200 Day Avg | Volume | Avg Volume | Open | Previous Close | Timestamp |
|:---------|:--------|---------:|-------------:|-------------:|----------:|-----------:|------------:|-----------:|-------------:|--------------:|---------:|-------------:|---------:|-----------------:|:--------------------|
| AEDAUD | AED/AUD | 0.40089 | 0.40826 | 0.00163 | 0.39766 | 0.40118 | 0.43341 | 0.38041 | 0.41514 | 0.41372 | 11 | nan | 0.39921 | 0.39926 | 2024-01-02 14:02:15 |
| AEDBHD | AED/BHD | 0.10262 | 0.0608637 | 6.2422e-05 | 0.10244 | 0.10266 | 0.10323 | 0.0991399 | 0.10264 | 0.10241 | 37 | 48.006 | 0.10256 | 0 | 2024-01-02 13:46:14 |
| AEDCAD | AED/CAD | 0.36177 | 0.43587 | 0.00157 | 0.35996 | 0.36295 | 0.37817 | 0.35657 | 0.3701 | 0.36716 | 14 | nan | 0.36002 | 0.3602 | 2024-01-02 14:02:15 |
| AEDCHF | AED/CHF | 0.23062 | 0.8704 | 0.00199 | 0.22847 | 0.23099 | 0.25693 | 0.2278 | 0.23976 | 0.24231 | nan | nan | 0.22847 | 0.22863 | 2024-01-02 14:02:15 |
| AEDDKK | AED/DKK | 1.84023 | 84.023 | 0.84023 | 1.83775 | 1.84081 | 1.94068 | 1.78424 | 1.86572 | 1.87037 | 16 | 49.5329 | 1.83874 | 1 | 2024-01-02 09:37:59 |
| AEDEUR | AED/EUR | 0.2486 | 0.81044 | 0.00199857 | 0.24636 | 0.24871 | 0.265 | 0.2417 | 0.25271 | 0.25197 | 38 | nan | 0.24668 | 0.2466 | 2024-01-02 14:02:15 |
| AEDGBP | AED/GBP | 0.21499 | 0.75924 | 0.00162 | 0.21298 | 0.2157 | 0.23039 | 0.2073 | 0.21802 | 0.21732 | 14 | nan | 0.2133 | 0.21337 | 2024-01-02 14:02:15 |
| AEDILS | AED/ILS | 0.98746 | -100 | nan | 0.98385 | 0.99536 | 1.1108 | 0.97828 | 1.01241 | 1.03478 | 923 | 549.264 | 0.98761 | nan | 2024-01-02 14:05:06 |
| AEDINR | AED/INR | 22.7025 | 0.14076 | 0.0319101 | 22.625 | 22.72 | 22.72 | 20.1966 | 19.8653 | 20.1966 | 14 | nan | 22.7082 | 22.6706 | 2024-01-02 14:02:15 |
| AEDJOD | AED/JOD | 0.19335 | -3.32563 | -0.00665126 | 0.19315 | 0.19364 | 0.19412 | 0.19185 | 0.19314 | 0.19315 | 38 | 18.8451 | 0.19331 | 0.2 | 2024-01-02 13:51:18 |
Commodities
Obtain commodity lists and company quotes that can be used in the Finance Toolkit.
> **Commodity List**
The commodity list function returns a complete list of all commodity symbols that can be used in the FinanceToolkit. These are over 1.000 symbols. Find the documentation [here](https://www.jeroenbouma.com/projects/financetoolkit/docs/discovery#get_commodity_list).
As an example:
```python
from financetoolkit import Discovery
discovery = Discovery(api_key="FINANCIAL_MODELING_PREP_KEY")
commodity_list = discovery.get_commodity_list()
commodity_list.head(10)
```
Which returns:
| Symbol | Name | Currency | Exchange |
|:---------|:-----------------------|:-----------|:-----------|
| ALIUSD | Aluminum Futures | USD | COMEX |
| BZUSD | Brent Crude Oil | USD | ICE |
| CCUSD | Cocoa | USD | ICE |
| CLUSD | Crude Oil | USD | CME |
| CTUSX | Cotton | USX | ICE |
| DCUSD | Class III Milk Futures | USD | CME |
| DXUSD | US Dollar | USD | ICE |
| ESUSD | E-Mini S&P 500 | USD | CME |
| GCUSD | Gold Futures | USD | CME |
| GFUSX | Feeder Cattle Futures | USX | CME |
> **Commodity Quotes**
Returns the quotes for each commodity. This includes the symbol, the name, the price, the change, the change percentage, day low, day high, year high, year low, market cap, 50 day average, 200 day average, volume, average volume, open, previous close, EPS, PE, earnings announcement, shares outstanding and the timestamp. Find the documentation [here](https://www.jeroenbouma.com/projects/financetoolkit/docs/discovery#get_commodity_quotes).
As an example:
```python
from financetoolkit import Discovery
discovery = Discovery(api_key="FINANCIAL_MODELING_PREP_KEY")
commodity_quotes = discovery.get_commodity_quotes()
commodity_quotes.head(10)
```
Which returns:
| Symbol | Name | Price | Change % | Change | Day Low | Day High | Year High | Year Low | 50 Day Avg | 200 Day Avg | Volume | Avg Volume | Open | Previous Close | Timestamp |
|:---------|:-----------------------|---------:|-----------:|---------:|----------:|-----------:|------------:|-----------:|-------------:|--------------:|---------:|-----------------:|---------:|-----------------:|:--------------------|
| ALIUSD | Aluminum Futures | 2347 | -1.12691 | -26.75 | 2344 | 2383.5 | 2670.75 | 2073.25 | 2200.86 | 2221.04 | 4321 | 22 | 2370.75 | 2373.75 | 2024-01-02 13:54:40 |
| BZUSD | Brent Crude Oil | 78.1 | 1.37591 | 1.06 | 77.21 | 79.06 | 97.63 | 68.2 | 81.291 | 81.9377 | 2285 | 30060 | 77.21 | 77.04 | 2024-01-02 14:10:12 |
| CCUSD | Cocoa | 4249.5 | 1.27502 | 53.5 | 101.03 | 4274.5 | 4478 | 2507 | 4115.52 | 3483.99 | 18596 | 14509 | 4209 | 4196 | 2024-01-02 14:10:12 |
| CLUSD | Crude Oil | 72.63 | 1.36776 | 0.98 | 71.63 | 73.65 | 95.03 | 63.64 | 76.3836 | 77.7364 | 37720 | 307715 | 71.71 | 71.65 | 2024-01-02 14:10:12 |
| CTUSX | Cotton | 80.78 | -0.2716 | -0.22 | 3.87 | 81.75 | 90.75 | 74.77 | 79.8394 | 82.7224 | 960 | 15911 | 80.87 | 81 | 2024-01-02 14:10:00 |
| DCUSD | Class III Milk Futures | 16.35 | 1.5528 | 0.25 | 15.43 | 17.16 | 20.49 | 13.75 | 16.6668 | 16.7265 | 51 | 212 | 16.1 | 16.1 | 2024-01-02 13:36:35 |
| DXUSD | US Dollar | 101.862 | 0.82452 | 0.833 | 101.027 | 101.88 | 107.05 | 99.22 | 103.915 | 103.24 | 2999 | 14880 | 101.065 | 101.029 | 2024-01-02 14:10:10 |
| ESUSD | E-Mini S&P 500 | 4783 | -0.76763 | -37 | 4777.75 | 4828 | 4841.5 | 3808.75 | 4527.31 | 4378.91 | 75910 | 1.63378e+06 | 4818 | 4820 | 2024-01-02 14:00:13 |
| GCUSD | Gold Futures | 2075 | 0.15446 | 3.2 | 2071.4 | 2094.7 | 2130.2 | 1808.1 | 2003.86 | 1960.64 | 38456 | 3511 | 2072.7 | 2071.8 | 2024-01-02 14:00:13 |
| GFUSX | Feeder Cattle Futures | 223.125 | 0.0112057 | 0.025 | 222.725 | 224.45 | 257.5 | 177.55 | 226.9 | 230.114 | 4395 | 3915 | 224.4 | 223.1 | 2023-12-29 19:04:57 |
ETFs & Indices
Obtain ETF and Index lists and quotes that can be used in the Finance Toolkit.
> **ETF List**
The etf list function returns a complete list of all etf symbols that can be used in the FinanceToolkit. Find the documentation [here](https://www.jeroenbouma.com/projects/financetoolkit/docs/discovery#get_etf_list).
As an example:
```python
from financetoolkit import Discovery
discovery = Discovery(api_key="FINANCIAL_MODELING_PREP_KEY")
etf_list = discovery.get_etf_list()
etf_list.head(10)
```
Which returns:
| Symbol | Name | Price | Exchange | Exchange Code |
|:----------|:------------------------------------------------------------------------------------------------|-----------:|:----------------------|:----------------|
| 01002T.TW | Cathay No.1 REIT | 17.29 | Taiwan | TAI |
| 020Y.L | iShares IV Public Limited Company - iShares Euro Government Bond 20yr Target Duration UCITS ETF | 3.9522 | London Stock Exchange | LSE |
| 069500.KS | KODEX 200 | 36390 | KSE | KSC |
| 069660.KS | KOSEF 200 | 36370 | KSE | KSC |
| 091160.KS | Kodex Semicon | 36840 | KSE | KSC |
| 091170.KS | Kodex Banks | 6695 | KSE | KSC |
| 091180.KS | Kodex Autos | 19450 | KSE | KSC |
| 091220.KS | Mirae Asset TIGER Banks ETF | 6845 | KSE | KSC |
| 091230.KS | Mirae Asset TIGER Semicon ETF | 38400 | KSE | KSC |
| 098560.KS | Mirae Asset TIGER Media & Telecom ETF | 7335 | KSE | KSC |
> **Index List**
The index list function returns a complete list of all etf symbols that can be used in the FinanceToolkit. Find the documentation [here](https://www.jeroenbouma.com/projects/financetoolkit/docs/discovery#get_index_list).
As an example:
```python
from financetoolkit import Discovery
discovery = Discovery(api_key="FINANCIAL_MODELING_PREP_KEY")
index_list = discovery.get_index_list()
index_list.head(10)
```
Which returns:
| Symbol | Name | Currency | Exchange |
|:------------|:------------------------------|:-----------|:-----------------------|
| 000001.SS | SSE Composite Index | CNY | Shanghai |
| 399967.SZ | CSI NATIONAL DEFENSE | CNY | Shenzhen |
| 512.HK | CES CHINA HK MAINLAND INDEX | HKD | HKSE |
| DX-Y.NYB | US Dollar/USDX - Index - Cash | USD | ICE Futures |
| FTSEMIB.MI | FTSE MIB Index | EUR | Milan |
| IAR.BA | MERVAL ARGENTINA | USD | Buenos Aires |
| IDX30.JK | IDX30 | IDR | Jakarta Stock Exchange |
| IMOEX.ME | MOEX Russia Index | RUB | MCX |
| ITLMS.MI | FTSE Italia All-Share Index | EUR | Milan |
| KOSPI200.KS | KOSPI 200 Index | KRW | KSE |
> **Index Quotes**
Returns the quotes for each index. This includes the symbol, the name, the price, the change, the change percentage, day low, day high, year high, year low, market cap, 50 day average, 200 day average, volume, average volume, open, previous close, EPS, PE, earnings announcement, shares outstanding and the timestamp. Find the documentation [here](https://www.jeroenbouma.com/projects/financetoolkit/docs/discovery#get_index_quotes).
As an example:
```python
from financetoolkit import Discovery
discovery = Discovery(api_key="FINANCIAL_MODELING_PREP_KEY")
index_quotes = discovery.get_index_quotes()
index_quotes.head(10)
```
Which returns:
| Symbol | Name | Price | Change % | Change | Day Low | Day High | Year High | Year Low | 50 Day Avg | 200 Day Avg | Volume | Avg Volume | Open | Previous Close | Timestamp |
|:------------|:------------------------------|----------:|-----------:|-----------:|----------:|-----------:|------------:|-----------:|-------------:|--------------:|-----------:|-------------:|----------:|-----------------:|------------:|
| 000001.SS | SSE Composite Index | 2962.28 | -0.4255 | -12.6587 | 2962.28 | 2976.27 | 3418.95 | 2882.02 | 2999.76 | 3160.83 | 349408228 | 290686 | 2972.78 | 2974.93 | 1704178820 |
| 399967.SZ | CSI NATIONAL DEFENSE | 9891.22 | 0.4875 | 47.9902 | 9834.98 | 10041.4 | 10041.4 | 9834.98 | 0 | 0 | 1115610197 | 0 | 9857.19 | 9843.23 | 1704184147 |
| 512.HK | CES CHINA HK MAINLAND INDEX | 6901.25 | 0 | 0 | 6786.45 | 6912.54 | 6912.54 | 6786.45 | 0 | 0 | 2785244718 | 0 | 6862.61 | nan | 1434960128 |
| DX-Y.NYB | US Dollar/USDX - Index - Cash | 102.136 | 0.7924 | 0.803 | 101.34 | 102.167 | 107.35 | 99.58 | 104.108 | 103.421 | 0 | 0 | 101.417 | 101.333 | 1704204265 |
| FTSEMIB.MI | FTSE MIB Index | 30396.8 | 0.1488 | 45.1699 | 30326.9 | 30863.6 | 30863.6 | 24111 | 29233.6 | 28164 | 0 | 473923362 | 30519.5 | 30351.6 | 1704203960 |
| IAR.BA | MERVAL ARGENTINA | 33784.6 | 0 | 33784.6 | 33227.6 | 33871.5 | 33871.5 | 33227.6 | 0 | 0 | 0 | 0 | 33227.6 | nan | 1576872141 |
| IDX30.JK | IDX30 | 498.424 | 0.6486 | 3.212 | 492.621 | 498.424 | 498.424 | 492.621 | 0 | 0 | 0 | 0 | 493.985 | 495.212 | 1704186018 |
| IMOEX.ME | MOEX Russia Index | 2222.51 | -0.1859 | -4.1399 | 2202.52 | 2234.55 | 4292.68 | 1681.55 | 2264.41 | 3183.63 | 0 | 0 | 2225.02 | 2226.65 | 1657295461 |
| ITLMS.MI | FTSE Italia All-Share Index | 32507 | 0.0859 | 27.9004 | 32434.3 | 32999.1 | 32999.1 | 23017.