https://github.com/jetbrains/lets-plot
Multiplatform plotting library based on the Grammar of Graphics
https://github.com/jetbrains/lets-plot
compose-multiplatform data-visualization datalore geo-spatial ggplot ggplot2 jupyter jupyter-notebooks kotlin plot plot-library plotting-in-kotlin plotting-in-python pycharm pycharm-plugin python sciview
Last synced: about 1 year ago
JSON representation
Multiplatform plotting library based on the Grammar of Graphics
- Host: GitHub
- URL: https://github.com/jetbrains/lets-plot
- Owner: JetBrains
- License: mit
- Created: 2019-03-20T16:13:03.000Z (over 7 years ago)
- Default Branch: master
- Last Pushed: 2025-05-12T14:05:06.000Z (about 1 year ago)
- Last Synced: 2025-05-12T15:26:31.436Z (about 1 year ago)
- Topics: compose-multiplatform, data-visualization, datalore, geo-spatial, ggplot, ggplot2, jupyter, jupyter-notebooks, kotlin, plot, plot-library, plotting-in-kotlin, plotting-in-python, pycharm, pycharm-plugin, python, sciview
- Language: Kotlin
- Homepage: https://lets-plot.org
- Size: 428 MB
- Stars: 1,665
- Watchers: 211
- Forks: 53
- Open Issues: 164
-
Metadata Files:
- Readme: README.md
- Changelog: CHANGELOG.md
- License: LICENSE
Awesome Lists containing this project
README
# Lets-Plot
[](https://confluence.jetbrains.com/display/ALL/JetBrains+on+GitHub)
[](https://raw.githubusercontent.com/JetBrains/lets-plot-kotlin/master/LICENSE)
[](https://github.com/JetBrains/lets-plot/releases/latest)
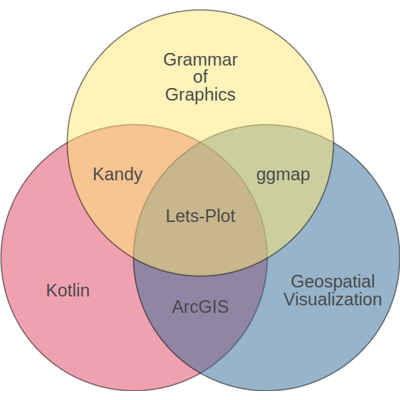
**Lets-Plot** is a multiplatform plotting library built on the principles of the Grammar of Graphics.
The library' design is heavily influenced by Leland Wilkinson work [The Grammar of Graphics](https://www.goodreads.com/book/show/2549408.The_Grammar_of_Graphics) describing the deep features that underlie all statistical graphics.
> This grammar [...] is made up of a set of independent components that can be composed in many different ways. This makes [it] very powerful because you are not limited to a set of pre-specified graphics, but you can create new graphics that are precisely tailored for your problem.
> - Hadley Wickham, "[ggplot2: Elegant Graphics for Data Analysis](https://ggplot2-book.org/index.html)"
## Grammar of Graphics for Python [](https://pypi.org/project/lets-plot)
A bridge between R (ggplot2) and Python data visualization. \
To learn more see the documentation site at **[lets-plot.org](https://lets-plot.org)**.
## Grammar of Graphics for Kotlin [](https://github.com/JetBrains/lets-plot-kotlin/releases/latest)
### Notebooks
Create plots in [Kotlin Notebook](https://plugins.jetbrains.com/plugin/16340-kotlin-notebook),
[Datalore](https://datalore.jetbrains.com/report/static/HZqq77cegYd.E7get_WnChZ/aTA9lQnPkRwdCzT6uy95GZ), [Jupyter with Kotlin Kernel](https://github.com/Kotlin/kotlin-jupyter#readme) \
or any other notebook that supports `Kotlin Kernel`. \
To learn more see the **[Lets-Plot Kotlin API](https://github.com/JetBrains/lets-plot-kotlin)** project at GitHub.
### Compose Multiplatform
Embed Lets-Plot charts in [Compose Multiplatform](https://github.com/JetBrains/compose-multiplatform) applications. \
To learn more see the **[Lets-Plot Skia Frontend](https://github.com/JetBrains/lets-plot-skia)** project at GitHub.
### JVM and Kotlin/JS
Embed Lets-Plot charts in JVM (Swing, JavaFX) and Kotlin/JS applications.
To learn more see the **[Lets-Plot Kotlin API](https://github.com/JetBrains/lets-plot-kotlin)** project at GitHub.
## "Lets-Plot in SciView" plugin
[](http://plugins.jetbrains.com/plugin/14379-lets-plot-in-sciview)
[](http://plugins.jetbrains.com/plugin/14379-lets-plot-in-sciview)
*Scientific mode* in PyCharm and in IntelliJ IDEA provides support for interactive scientific computing and data visualization.
[*Lets-Plot in SciView*](https://plugins.jetbrains.com/plugin/14379-lets-plot-in-sciview) plugin adds
support for interactive plotting to IntelliJ-based IDEs with the *Scientific mode* enabled.
>
> **Note:** The *Scientific mode* is NOT available in communinty editions of JetBrains IDEs.
>
Also read:
- [Scientific mode in PyCharm](https://www.jetbrains.com/help/pycharm/matplotlib-support.html)
- [Scientific mode in IntelliJ IDEA](https://www.jetbrains.com/help/idea/matplotlib-support.html)
## What is new in 4.4.0
- #### Waterfall Plot
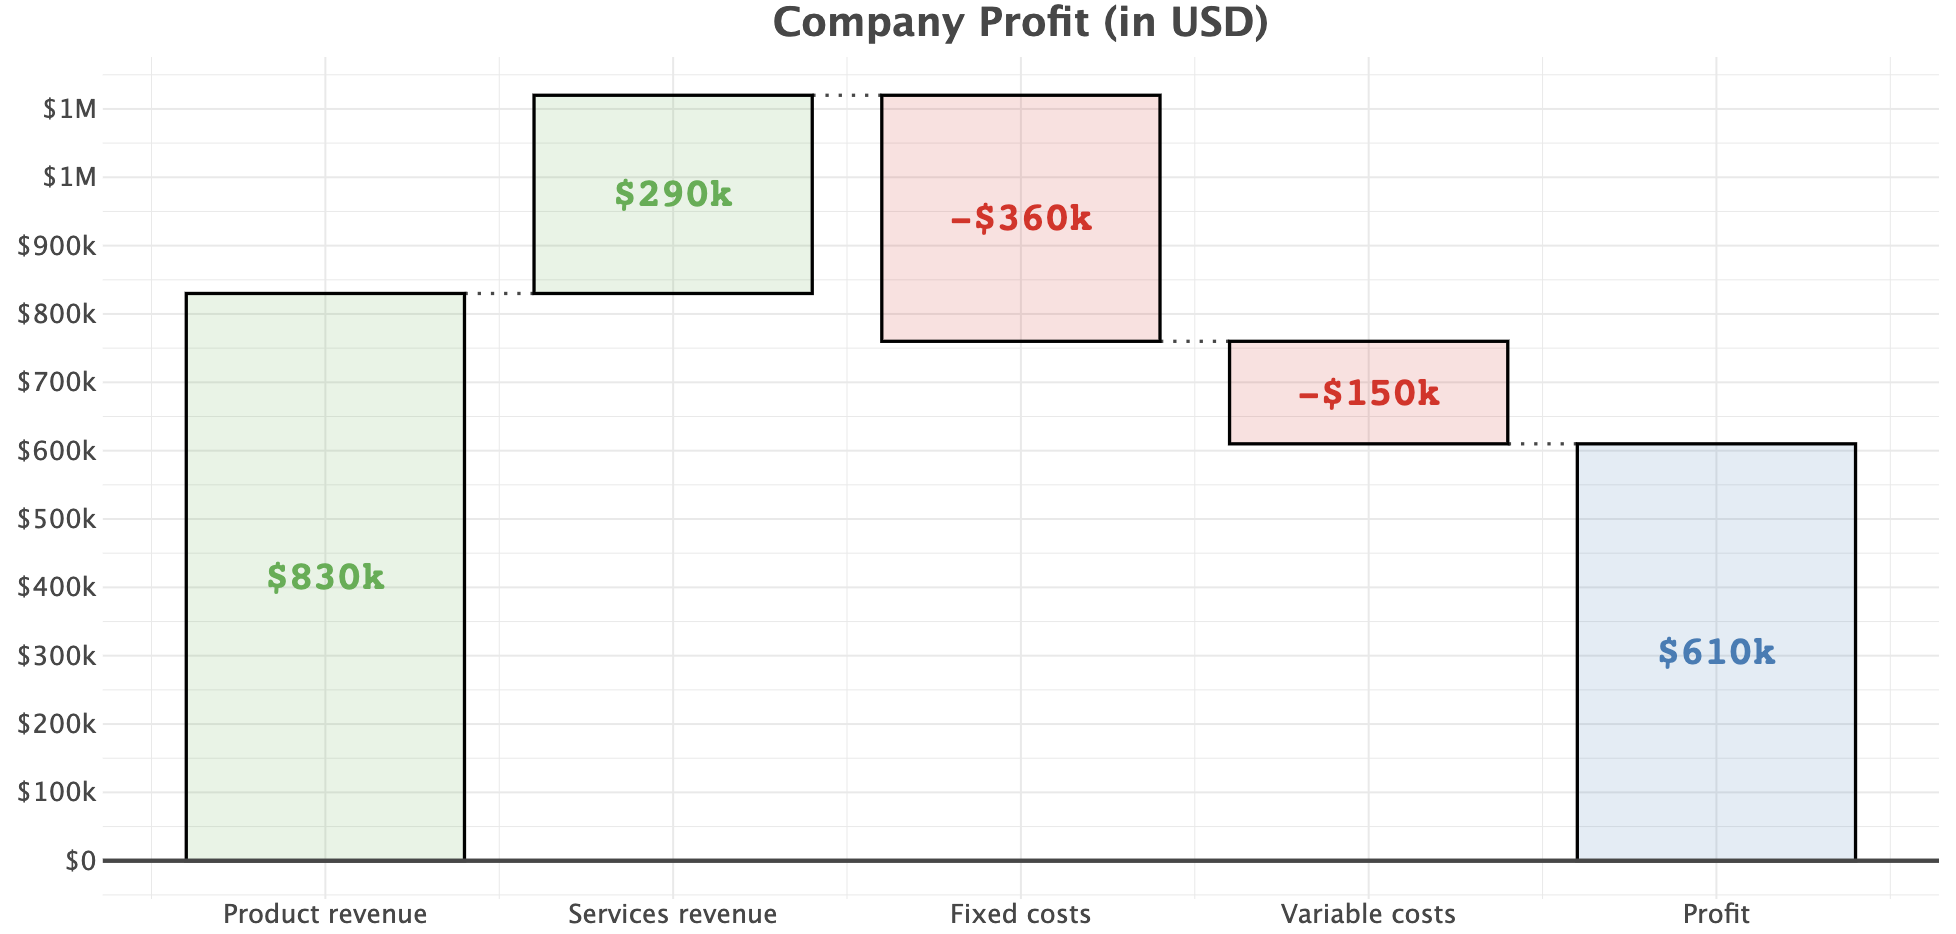
See [example notebook](https://nbviewer.org/github/JetBrains/lets-plot/blob/master/docs/f-24e/waterfall_plot.ipynb).
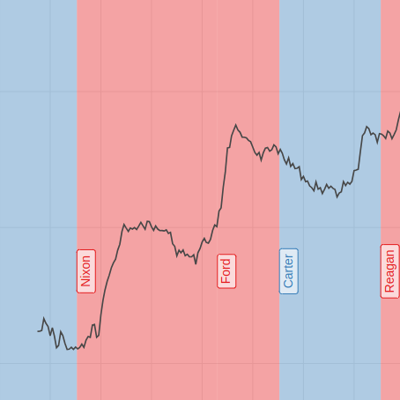
- #### **`geom_band()`**:
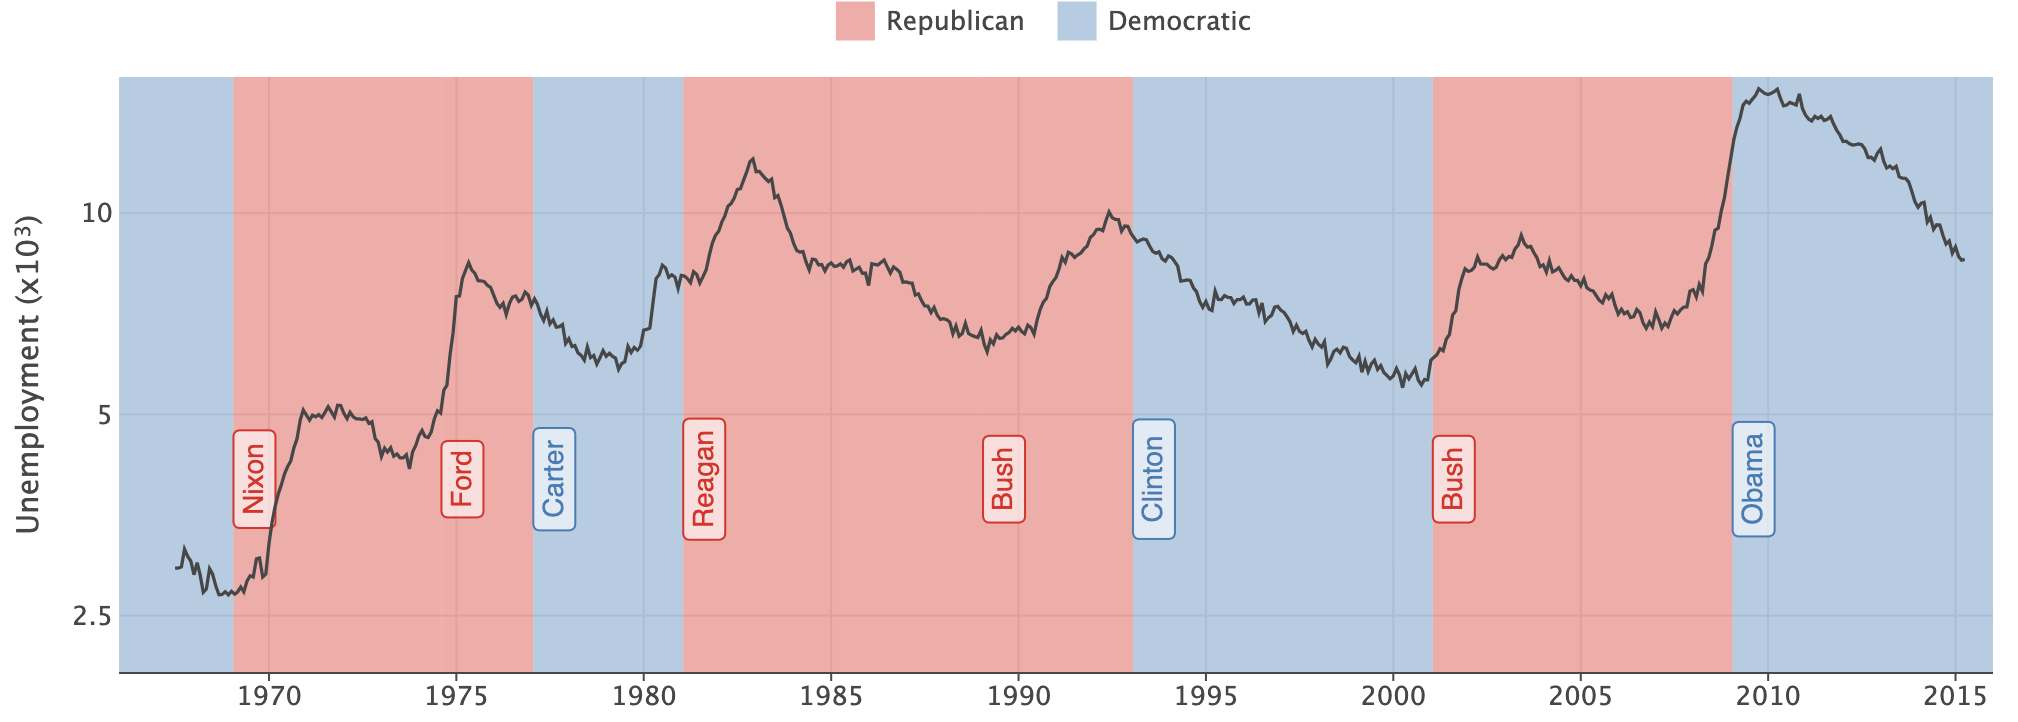
See [example notebook](https://nbviewer.org/github/JetBrains/lets-plot/blob/master/docs/f-24e/geom_band.ipynb).
- #### Custom Legends
- `manual_key` parameter in plot layer
- `layer_key()` function
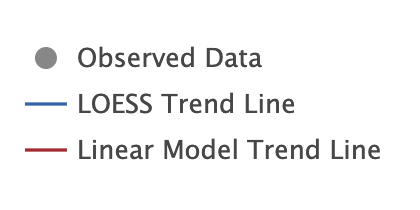
See [example notebook](https://nbviewer.org/github/JetBrains/lets-plot/blob/master/docs/f-24e/manual_legend.ipynb).
- #### Customizing Legends Appearance
The `override_aes` parameter in the `guide_legend()` function.
See [example notebook](https://nbviewer.org/github/JetBrains/lets-plot/blob/master/docs/f-24e/legend_override_aes.ipynb).
- #### And More
See [CHANGELOG.md](https://github.com/JetBrains/lets-plot/blob/master/CHANGELOG.md) for a full list of changes.
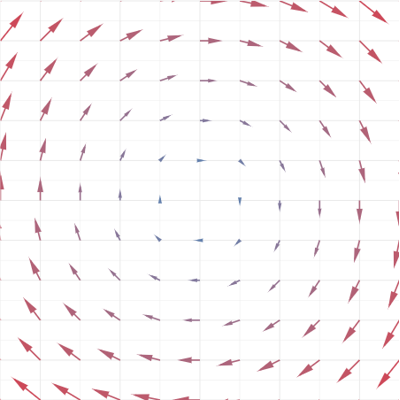
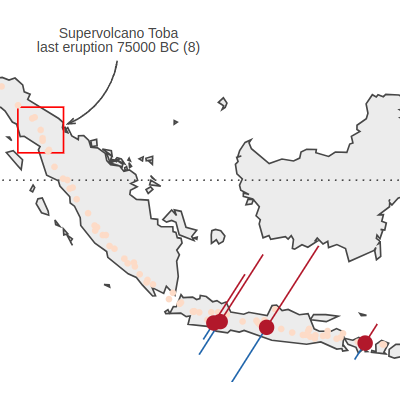
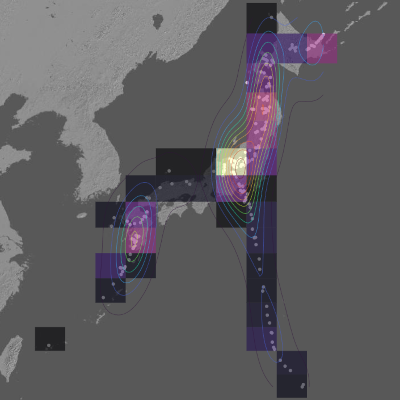
## Recent Updates in the [Gallery](https://lets-plot.org/python/pages/gallery.html)
## Change Log
[CHANGELOG.md](https://github.com/JetBrains/lets-plot/blob/master/CHANGELOG.md)
## Code of Conduct
This project and the corresponding community are governed by the
[JetBrains Open Source and Community Code of Conduct](https://confluence.jetbrains.com/display/ALL/JetBrains+Open+Source+and+Community+Code+of+Conduct).
Please make sure you read it.
## License
Code and documentation released under the [MIT license](https://github.com/JetBrains/lets-plot/blob/master/LICENSE).
Copyright © 2019-2024, JetBrains s.r.o.