https://github.com/jftuga/flash_read_cache_stats
View stats from ESX's Flash Read Cache using Grafana and InfluxDB
https://github.com/jftuga/flash_read_cache_stats
Last synced: about 1 month ago
JSON representation
View stats from ESX's Flash Read Cache using Grafana and InfluxDB
- Host: GitHub
- URL: https://github.com/jftuga/flash_read_cache_stats
- Owner: jftuga
- License: mit
- Created: 2018-09-12T17:15:24.000Z (almost 8 years ago)
- Default Branch: master
- Last Pushed: 2018-09-12T19:57:43.000Z (almost 8 years ago)
- Last Synced: 2025-10-08T20:24:55.704Z (10 months ago)
- Language: PowerShell
- Homepage:
- Size: 158 KB
- Stars: 2
- Watchers: 1
- Forks: 0
- Open Issues: 0
-
Metadata Files:
- Readme: README.md
- License: LICENSE
Awesome Lists containing this project
README
## Flash Read Cache Stats
View statistics from ESX's Flash Read Cache using Granfana and InfluxDB
This is a method to save (long-term) and view statistics for the vSphere Flash Read Cache. It was tested against ESX 6.7. This was a short lived project as we will now be using third-party caching software, but I wanted to throw something up on GitHub while it is still fresh in my memory.
The idea is to run `flash_cache_stats.ps` continuously. It will query all esx hosts defined by `$vcenter_server` for flash cache statistics. The powershell script queries the hosts every `$run_interval` minutes. I recommend not setting this below 2 minutes for 3 hosts. The more hosts and VMs you have, the longer time interval you should use.
After statictics are collected, they are stored in the `$influxdb_measurement` InfluxDB measurement table. Other settings for your InfluxDB server are stored in `influxdb_config.json`
_____
Edit these settings in `flash_cache_stats.ps1`
- $vcenter_server
- $run_interval
- $influxdb_measurement
Edit these settings in `influxdb_config.json`
- host
- port
- name (this is the name of the InfluxDB database)
Edit `grafana_vm_template.json` (this is for Grafana)
- replace `vfc-IDNUM-GUEST` with the cache name, as returned by this command: `esxcli storage vflash cache list`
- replace `VMNAME` with the VM name
- replace `INFLUXMEASUREMENT` with the name of your influxdb measurement table, eg: `$influxdb_measurement`
_____
# To get started
- Install the VMware PowerCLI by running: `Install-Module -Name VMware.PowerCLI`
- Run `flash_cache_stats.ps1` for about 10 minutes in order to get data into influxdb
- Verify that results are being saved into the database:
```sql
use vmware
-- or whatever you named your database; see the 'db' setting in the influxdb_config.json
SELECT count(MeandiskIOlatencyinmicroseconds) FROM XXX WHERE ("namespace" = 'Read' ) AND time >= now() - 120m
-- where XXX is the name of your measurement table, $influxdb_measurement
```
- This should return a count result greater than 0
- Edit your Granfana's InfluxDB data source
- Import your edited `grafana_vm_template.json` file into your Grafana instance
- Once configured, you should be able to see results in Grafana
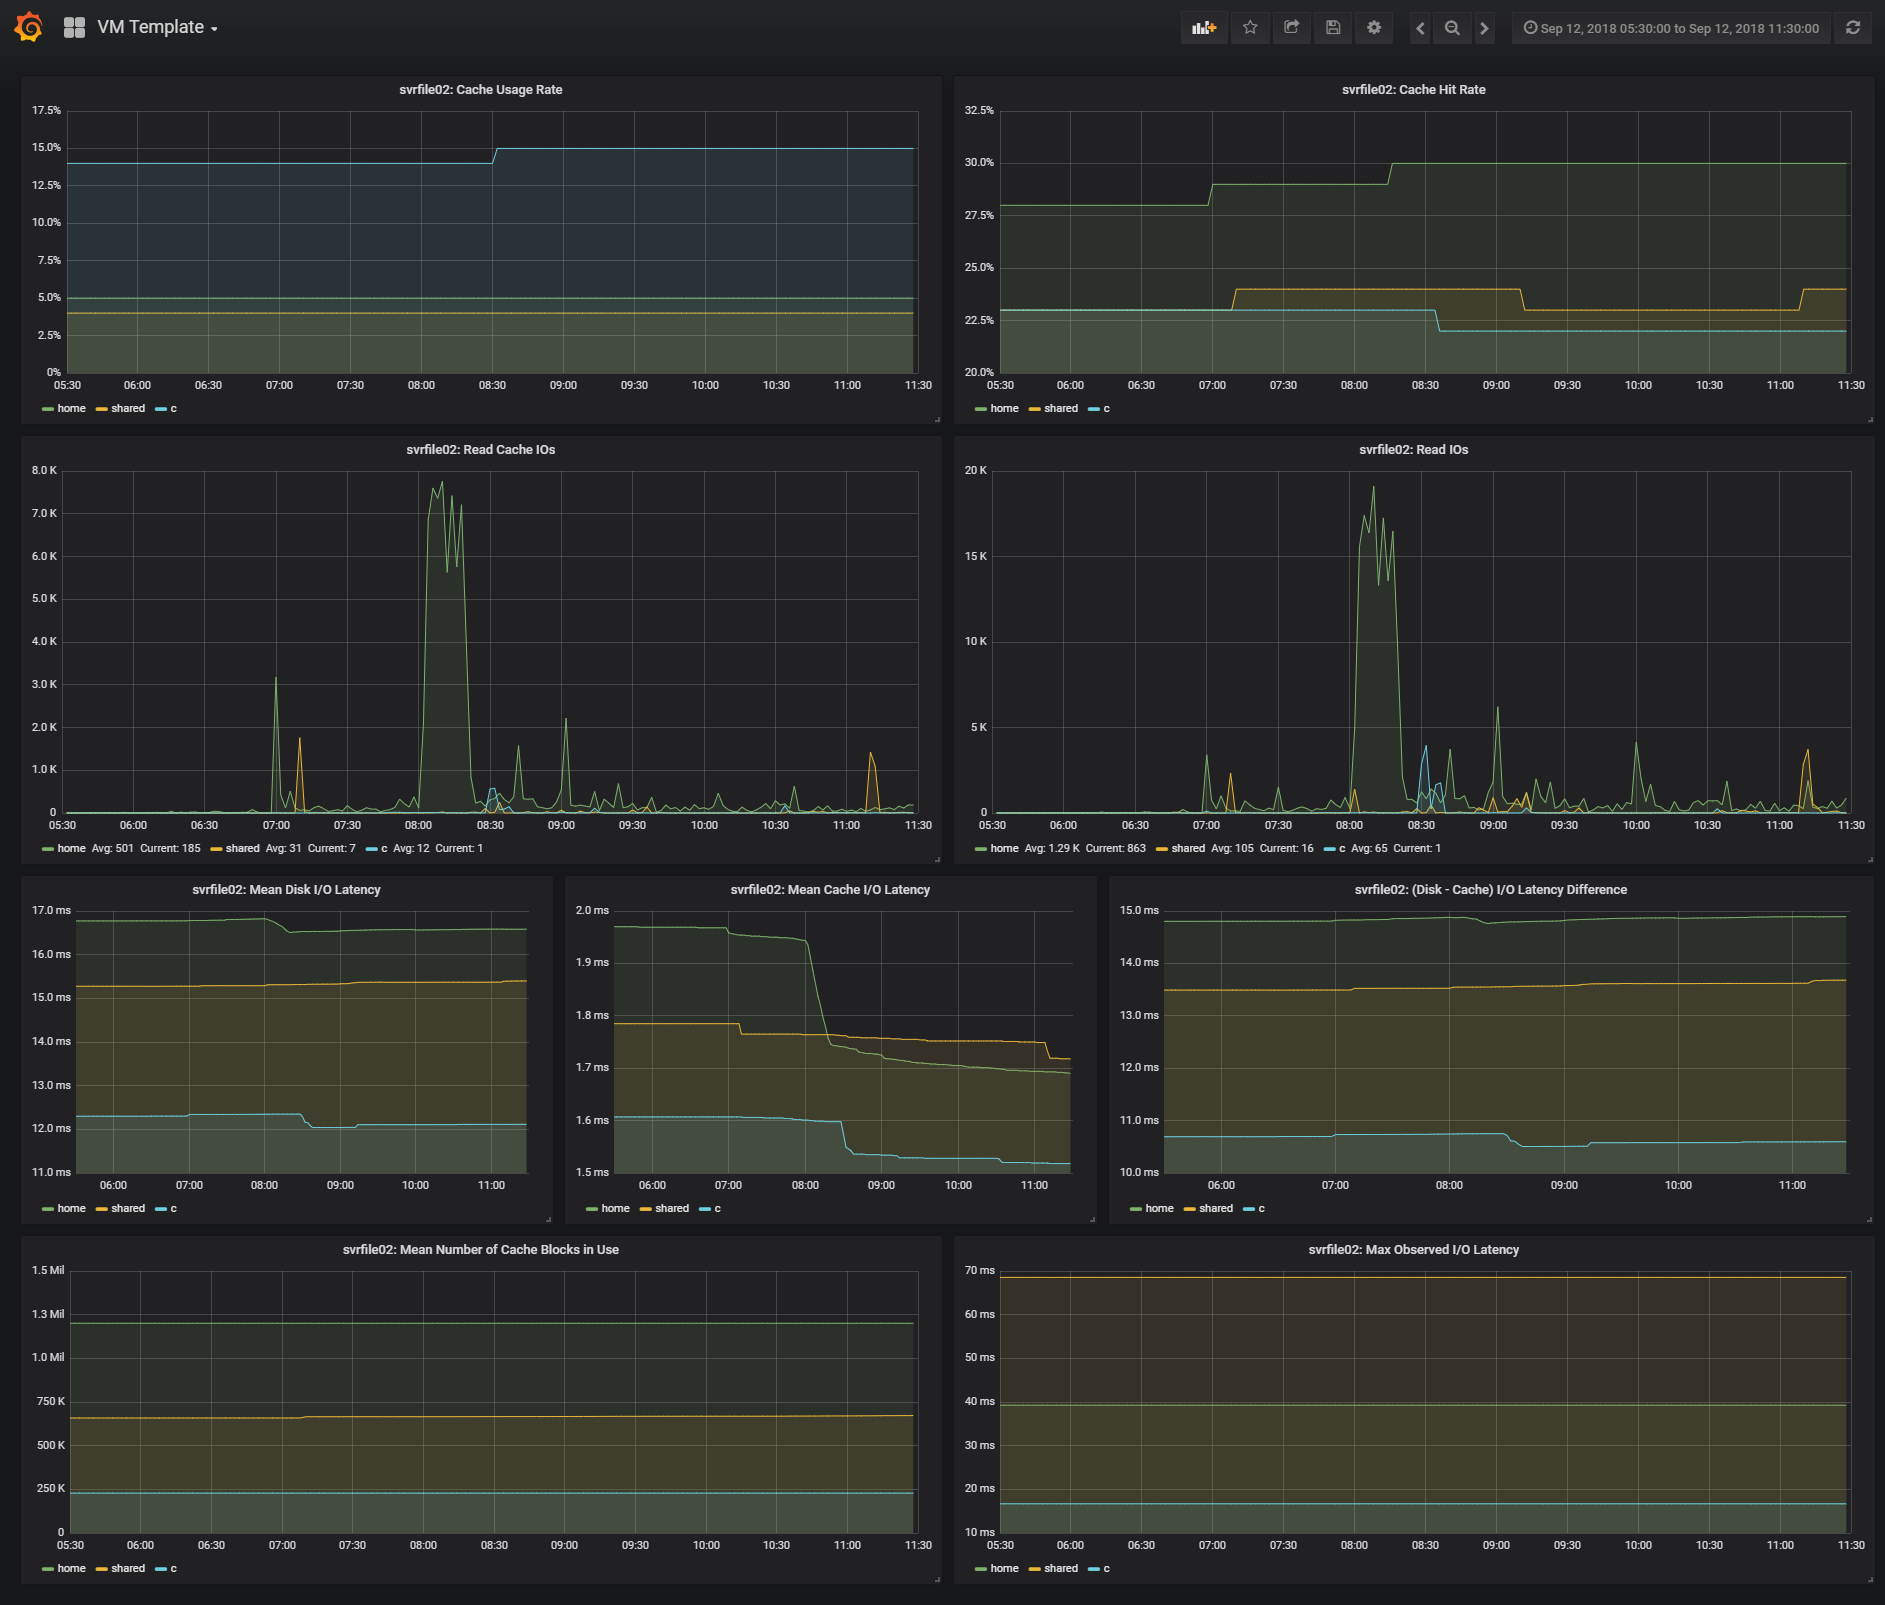
- Example graphs: https://raw.githubusercontent.com/jftuga/flash_read_cache_stats/master/grafana_example.png
____
Example CLI output:
```
[root@esx1:~] esxcli storage vflash cache stats get -c vfc-3111222333-SVRFILE02
Read:
Cache hit rate (as a percentage): 12
Total cache I/Os: 167190
Mean cache I/O latency (in microseconds): 307
Mean disk I/O latency (in microseconds): 12248
Total I/Os: 1436803
Mean IOPS: 183
Max observed IOPS: 212
Mean number of KB per I/O: 170
Max observed number of KB per I/O: 9842
Mean I/O latency (in microseconds): 5455
Max observed I/O latency (in microseconds): 7078
Evict:
Last I/O operation time (in microseconds): 0
Number of I/O blocks in last operation: 0
Mean blocks per I/O operation: 0
Cache usage rate (as a percentage): 11
Total failed SSD I/Os: 0
Total failed disk I/Os: 0
Mean number of cache blocks in use: 1068360
```
- The InfluxDB measurement is structured in 3 namespaces: `Read, Evict and Global`. The last 4 stats in the example output is saved in the `Global` namespace.
____
ESX <-> PowerCLI mappings
| esxcli output | PowerCLI | Example Value |
|--------------------------------------------|------------------------------------|---------------|
| Cache hit rate (as a percentage) | Cachehitrateasapercentage | 16 |
| Max observed I/O latency (in microseconds) | MaxobservedIOlatencyinmicroseconds | 4154 |
| Max observed IOPS | MaxobservedIOPS | 332 |
| Max observed number of KB per I/O | MaxobservednumberofKBperIO | 7521 |
| Mean I/O latency (in microseconds) | MeanIOlatencyinmicroseconds | 3511 |
| Mean IOPS | MeanIOPS | 284 |
| Mean cache I/O latency (in microseconds) | MeancacheIOlatencyinmicroseconds | 111 |
| Mean disk I/O latency (in microseconds) | MeandiskIOlatencyinmicroseconds | 8278 |
| Mean number of KB per I/O | MeannumberofKBperIO | 427 |
| Total I/Os | TotalIOs | 71525 |
| Total cache I/Os | TotalcacheIOs | 11258 |
| (TotalIOs - TotalcacheIOs) | TotaldiskIOs | 60267 |
| Cache usage rate (as a percentage) | Cacheusagerateasapercentage | 7 |
| Mean number of cache blocks in use | Meannumberofcacheblocksinuse | 89807 |
____
Example Graphs: