https://github.com/jhk0530/shinyAssemble
Visualize shiny applications structure
https://github.com/jhk0530/shinyAssemble
shinyapps visualize
Last synced: 4 months ago
JSON representation
Visualize shiny applications structure
- Host: GitHub
- URL: https://github.com/jhk0530/shinyAssemble
- Owner: jhk0530
- License: mit
- Created: 2020-03-08T12:36:02.000Z (over 5 years ago)
- Default Branch: master
- Last Pushed: 2020-04-19T07:56:18.000Z (over 5 years ago)
- Last Synced: 2024-08-13T07:14:52.811Z (over 1 year ago)
- Topics: shinyapps, visualize
- Language: R
- Homepage: https://jhkim.shinyapps.io/shinyAssemble/
- Size: 57.6 KB
- Stars: 4
- Watchers: 3
- Forks: 1
- Open Issues: 1
-
Metadata Files:
- Readme: README.md
- License: LICENSE
Awesome Lists containing this project
- jimsghstars - jhk0530/shinyAssemble - Visualize shiny applications structure (R)
README
# :yellow_heart: shinyAssemble 
shinyAssemble reads Shiny applications code ( one file `app.R` with `ui`, `server` )
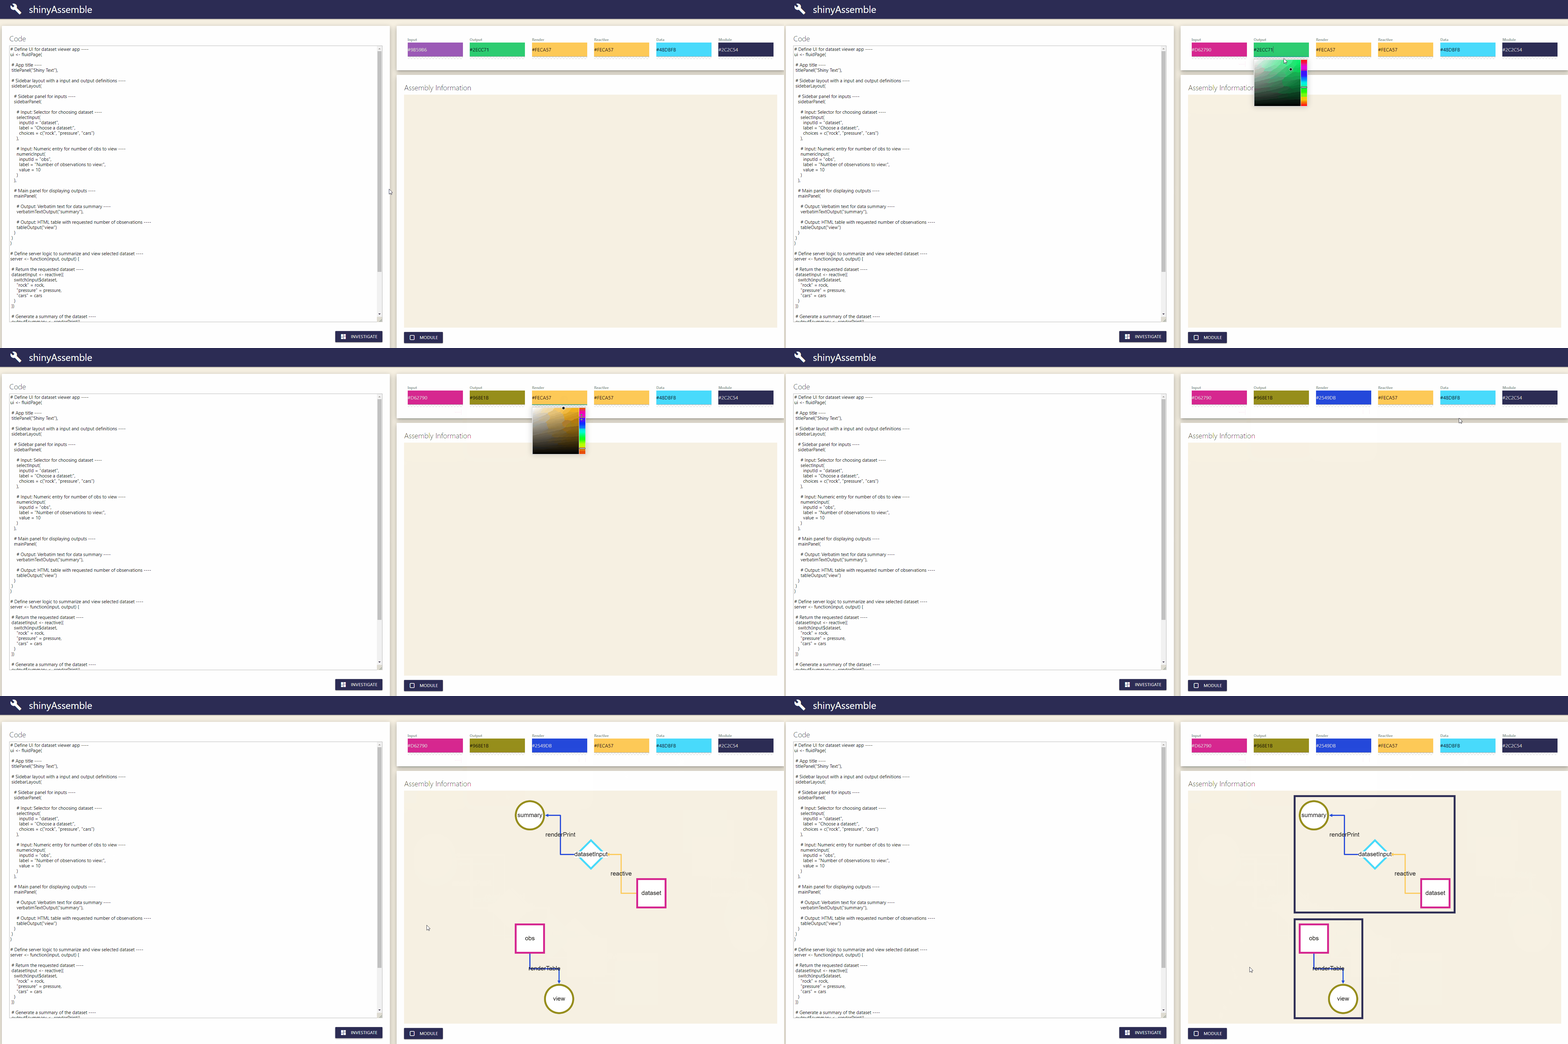
to Visualize shiny application's structure ( as **Assembly Instruction Style** :stuck_out_tongue_winking_eye: )
note that, hovering node will show element's type !
### :wrench: Install
use this code
```R
remotes::install_github('jhk0530/shinyAssemble')
library(shinyAssemble)
shinyAssemble()
```
### :page_facing_up: How to Use
1. Give code in code area in left.
2. Select color options in right-top.
3. push `investigate` button.
4. push `module` button. (optional)
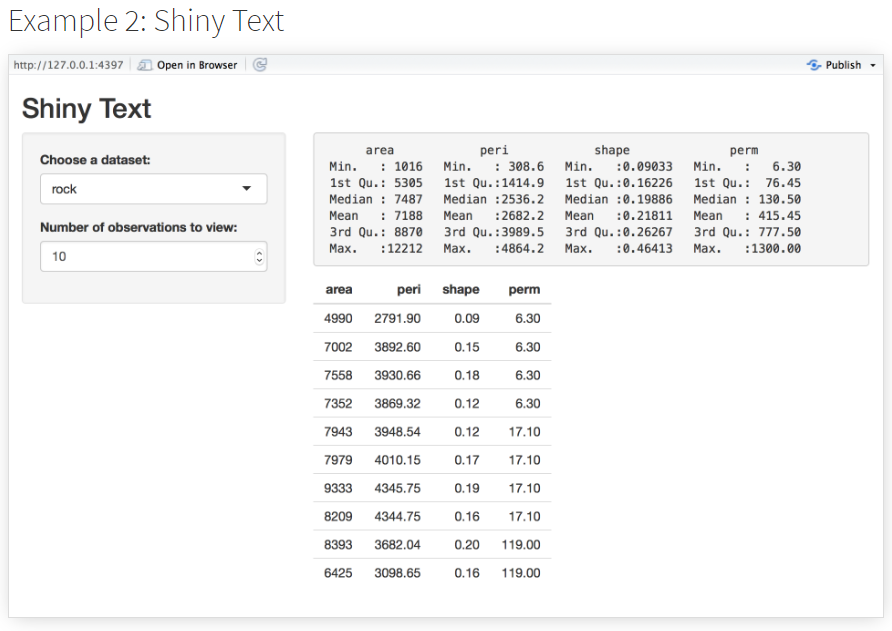
## [Example, Shiny Text](https://shiny.rstudio.com/articles/basics.html)

### Result

### Codes (prepared in Shiny App)
```R
# Define UI for dataset viewer app ----
ui <- fluidPage(
# App title ----
titlePanel("Shiny Text"),
# Sidebar layout with a input and output definitions ----
sidebarLayout(
# Sidebar panel for inputs ----
sidebarPanel(
# Input: Selector for choosing dataset ----
selectInput(
inputId = "dataset",
label = "Choose a dataset:",
choices = c("rock", "pressure", "cars")
),
# Input: Numeric entry for number of obs to view ----
numericInput(
inputId = "obs",
label = "Number of observations to view:",
value = 10
)
),
# Main panel for displaying outputs ----
mainPanel(
# Output: Verbatim text for data summary ----
verbatimTextOutput("summary"),
# Output: HTML table with requested number of observations ----
tableOutput("view")
)
)
)
# Define server logic to summarize and view selected dataset ----
server <- function(input, output) {
# Return the requested dataset ----
datasetInput <- reactive({
switch(input$dataset,
"rock" = rock,
"pressure" = pressure,
"cars" = cars
)
})
# Generate a summary of the dataset ----
output$summary <- renderPrint({
dataset <- datasetInput()
summary(dataset)
})
# Show the first "n" observations ----
output$view <- renderTable({
head(datasetInput(), n = input$obs)
})
}
```
------
### [Example 2 Miles per Gallon](https://shiny.rstudio.com/articles/build.html)
### Codes
``` R
# Define UI for miles per gallon app ----
ui <- fluidPage(
# App title ----
titlePanel("Miles Per Gallon"),
# Sidebar layout with input and output definitions ----
sidebarLayout(
# Sidebar panel for inputs ----
sidebarPanel(
# Input: Selector for variable to plot against mpg ----
selectInput(
"variable", "Variable:",
c(
"Cylinders" = "cyl",
"Transmission" = "am",
"Gears" = "gear"
)
),
# Input: Checkbox for whether outliers should be included ----
checkboxInput("outliers", "Show outliers", TRUE)
),
# Main panel for displaying outputs ----
mainPanel(
# Output: Formatted text for caption ----
h3(textOutput("caption")),
# Output: Plot of the requested variable against mpg ----
plotOutput("mpgPlot")
)
)
)
# Data pre-processing ----
# Tweak the "am" variable to have nicer factor labels -- since this
# doesn't rely on any user inputs, we can do this once at startup
# and then use the value throughout the lifetime of the app
mpgData <- mtcars
mpgData$am <- factor(mpgData$am, labels = c("Automatic", "Manual"))
# Define server logic to plot various variables against mpg ----
server <- function(input, output) {
# Compute the formula text ----
# This is in a reactive expression since it is shared by the
# output$caption and output$mpgPlot functions
formulaText <- reactive({
paste("mpg ~", input$variable)
})
# Return the formula text for printing as a caption ----
output$caption <- renderText({
formulaText()
})
# Generate a plot of the requested variable against mpg ----
# and only exclude outliers if requested
output$mpgPlot <- renderPlot({
boxplot(as.formula(formulaText()),
data = mpgData,
outline = input$outliers,
col = "#75AADB", pch = 19
)
})
}
```
### Result

### :paperclip: Dependency
* [shiny](https://github.com/rstudio/shiny) - 1.4.0
* [shinyCyJS](https://github.com/jhk0530/shinyCyJS) - 0.0.11
* [shinymaterial](https://github.com/ericrayanderson/shinymaterial) - 1.0.1
* [colourpicker](https://github.com/daattali/colourpicker) - 1.0
* [shinyjs](https://github.com/daattali/shinyjs) - 1.1
### :exclamation: Impotant
- If you load both `colourpicker` and `shinyjs` library, they will make collision. `shinyAssemble` only needs to load `colourpicker` and use ```R shinyjs::runjs() ``` instead load `shinyjs`
- use `styled code`, (more specifically I used tidyverse style with `styler`)
### :blush: Authors
* :octocat: jhk0530 [@jhk0530](https://github.com/jhk0530)
### :cloud: ShinyApps
https://jhkim.shinyapps.io/shinyAssemble/
### :memo: License
Copyright :copyright: 2020 Jinhwan Kim
This project is [MIT](https://opensource.org/licenses/MIT) licensed
*This README was generated with :two_hearts: by [shinyReadme](http://github.com/jhk0530/shinyReadme)*