https://github.com/jjoe64/GraphView
Android Graph Library for creating zoomable and scrollable line and bar graphs.
https://github.com/jjoe64/GraphView
android android-library graphs
Last synced: 10 months ago
JSON representation
Android Graph Library for creating zoomable and scrollable line and bar graphs.
- Host: GitHub
- URL: https://github.com/jjoe64/GraphView
- Owner: jjoe64
- License: other
- Created: 2011-07-04T13:25:41.000Z (over 14 years ago)
- Default Branch: master
- Last Pushed: 2023-01-11T03:13:55.000Z (about 3 years ago)
- Last Synced: 2025-04-11T00:53:16.303Z (10 months ago)
- Topics: android, android-library, graphs
- Language: Java
- Homepage: https://github.com/jjoe64/GraphView/wiki
- Size: 3.34 MB
- Stars: 2,772
- Watchers: 127
- Forks: 812
- Open Issues: 176
-
Metadata Files:
- Readme: README.markdown
- License: license.txt
Awesome Lists containing this project
- awesome-github-android-ui - GraphView - 通过编程创建灵活好看的图表 (图表(Chart))
- awesome-android-ui - https://github.com/jjoe64/GraphView
README
# Chart and Graph Library for Android
## Project maintainer wanted! For time reasons I can not continue to maintain GraphView. Contact me if you are interested and serious about this project. g.jjoe64@gmail.com
## What is GraphView
GraphView is a library for Android to programmatically create
flexible and nice-looking diagrams.
It is **easy** to understand, to integrate and to customize.
Supported graph types:
* Line Graphs
* Bar Graphs
* Point Graphs
* or implement your own custom types.


## Top Features
* Line Chart, Bar Chart, Points
* Combination of different graph types
* Scrolling vertical and horizontal
. You can scroll with a finger touch move gesture.
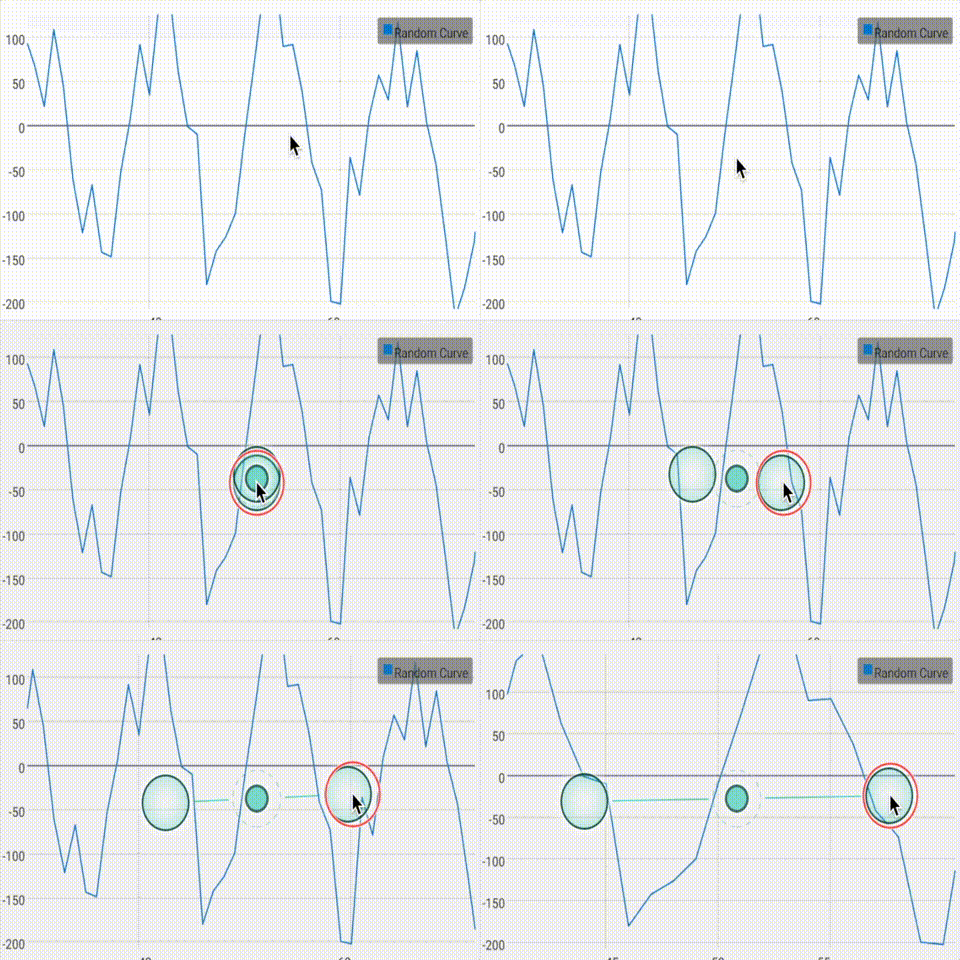
* Scaling / Zooming vertical and horizontal
. With two-fingers touch scale gesture (Multi-touch), the viewport can be changed.
* Realtime Graph (Live change of data)
* Second scale axis
* Draw multiple series of data
. Let the diagram show more that one series in a graph. You can set a color and a description for every series.
* Show legend
. A legend can be displayed inline the chart. You can set the width and the vertical align (top, middle, bottom).
* Custom labels
. The labels for the x- and y-axis are generated automatically. But you can set your own labels, Strings are possible.
* Handle incomplete data
. It's possible to give the data in different frequency.
* Viewport
. You can limit the viewport so that only a part of the data will be displayed.
* Manual Y axis limits
* And much more... Check out the project page and/or the demo app
## How to use
1) Add gradle dependency:
```
implementation 'com.jjoe64:graphview:4.2.2'
```
2) Add view to layout:
```xml
```
3) Add some data:
```java
GraphView graph = (GraphView) findViewById(R.id.graph);
LineGraphSeries series = new LineGraphSeries(new DataPoint[] {
new DataPoint(0, 1),
new DataPoint(1, 5),
new DataPoint(2, 3),
new DataPoint(3, 2),
new DataPoint(4, 6)
});
graph.addSeries(series);
```
## Download Demo project at Google Play Store
## More examples and documentation
Get started at project wiki homepage
To show you how to integrate the library into an existing project see the GraphView-Demos project!
See GraphView-Demos for examples.
https://github.com/jjoe64/GraphView-Demos
View GraphView wiki page https://github.com/jjoe64/GraphView/wiki