https://github.com/jlord/sheetsee-cache
write/cache google spreadsheet data with node.js - work in progress
https://github.com/jlord/sheetsee-cache
Last synced: 5 months ago
JSON representation
write/cache google spreadsheet data with node.js - work in progress
- Host: GitHub
- URL: https://github.com/jlord/sheetsee-cache
- Owner: jlord
- License: other
- Created: 2013-04-07T23:58:43.000Z (almost 13 years ago)
- Default Branch: master
- Last Pushed: 2013-09-29T19:42:30.000Z (over 12 years ago)
- Last Synced: 2025-06-21T12:05:49.426Z (7 months ago)
- Language: JavaScript
- Size: 1.54 MB
- Stars: 23
- Watchers: 3
- Forks: 9
- Open Issues: 3
-
Metadata Files:
- Readme: readme.md
- License: license.md
Awesome Lists containing this project
README
_This is the WIP server-side version, client side version is here: [github.com/jllord/sheetsee.js](http://github.com/jllord/sheetsee.js)_
### Server-side Hookup
The server-side version is in the repo [sheetsee-cache](http://www.github.com/jllord/sheetsee-cache). It uses [Node.js](http://www.nodejs.org) to go to Google, get the spreadsheet data (with a Node.js version of [Tabletop.js](http://npmjs.org/tabletop), thanks Max Ogden!) and save it on the server. This means every user that visits the page doesn't have to wait on Google's response to load the charts from the data.
When the server builds your page, it will build in your data as the variable gData. All you need to do is add your scripts to the bottom of the page. For the tables/templating you'll need to wrap them in an event listener so that it doesn't try and build them before the data has settled.
document.addEventListener('DOMContentLoaded', function() {
// table/templating things the rest can be in their own script tags if you'd like
})
#### Running Locally
You can run this locally and it will check your internet connection - if you're not online it will use the last saved data allowing you to develop offline, yay!
Once you clone the repo, navigate there in Terminal and type:
cd sheetsee-cache
npm install
node server.js
This will launch a local server you can visit and develop locally with in your browser.
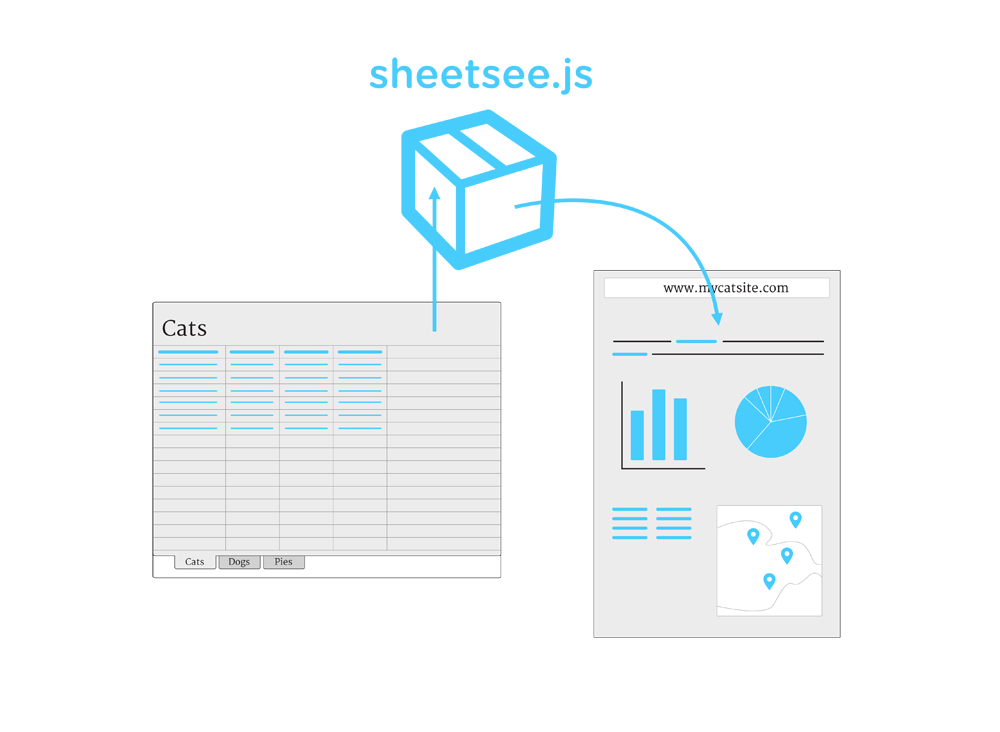
# Sheetsee.js
Sheetsee.js is a JavaScript library, or box of goodies, if you will, that makes it easy to use a Google Spreadsheet as the database feeding the tables, charts and maps on a website. Once set up, any changes to the spreadsheet will auto-saved by Google and be live on your site when a visitor refreshes the page.
Using Google Spreadsheets as the backend database is awesome because it is easy to use, share and collaborate with.
To use sheetsee.js you'll definitely need to know HTML, CSS and know JavaScript or be not afraid of it and just type what these docs tell you to type. Also, see [JavaScript for Cats](http://www.jsforcats.com), [Eloquent JavaScript](http://eloquentjavascript.net/) or [Mozilla's Developer Network](https://developer.mozilla.org/en-US/docs/JavaScript).
### Dependencies
Sheetsee.js depends on a few other awesome JavaScript libraries to make all this happen. First, [Tabletop.js](http://builtbybalance.com/Tabletop/) gets the data from the Google Spreadsheet and makes it nice. Once you have your data Sheetsee.js makes it easy to set up tables or templates with [IChanHas.js](http://icanhazjs.com/)(built on [mustache.js](http://mustache.github.io/)), maps with [Mapbox.js](http://mapbox.com/mapbox.js/example/v1.0.0/), and charts with [d3.js](http://d3js.org/). And [jQuery](http://jquery.com/) of course powers most of the interactions. It also has many sorting and filtering functions built in so that you can display different parts of your data if you want. Each of these are explained in more detail below.
### CSS
Sheetsee.js comes with a bare minimum stylesheet. This way you can customize your site to look the way you want to it or to match an existing site's design.
### Client-side or Server-side
Sheetsee.js comes in two flavors, client-side (this repo) and server-side ([sheetsee-cache](http://www.github.com/jlord/sheetsee-cache). The client-side is the most approachable and straightforward, you just include sheetsee.js and the dependencies on your page and use sheetsee.js as normal.
The server-side version is built with [Node.js](http://www.nodejs.org) and you'll need to understand Node and be publishing to a server that runs Node.js apps. This version saves the data on the server so that the browser doesn't have to fetch from Google at every request, which can sometimes be slow. You can set when the cache expires. It also allows for offline development, huzzah!
## The Short & Sweet
1. Link to Sheetsee.js and dependencies in your HTML header.
2. Create a place holder `
` in your HTML for any chart, map or table you want to have.
3. Create templates for tables in `` tags.
4. Create a script tag that waits for the document to load and then executes any of the map, chart or tables you've specified in it.
5. Set it and forget. Now all you need to do is edit the spreadsheet and visitors will get the latest information everytime they load the page.
## Bare Minimum Setup
Ignoring some HTML things to conserve space, you get the point. This gives you a page with a map of your spreadsheets points.
<html>
<head>
<script type="text/javascript" src="http://api.tiles.mapbox.com/mapbox.js/v1.0.0/mapbox.js">
#map {height: 600px; width: 600px;}
optionsJSON = ["something", "something"]
var geoJSON = Sheetsee.createGeoJSON(gData, featureElements)
var map = Sheetsee.loadMap("map")
Sheetsee.addTileLayer(map, 'examples.map-20v6611k')
var markerLayer = Sheetsee.addMarkerLayer(geoJSON, map)