https://github.com/jmcph4/blocktop
A minimalist TUI block explorer for Ethereum networks
https://github.com/jmcph4/blocktop
block-explorer blockchain blockchain-indexer blockchain-indexing ethereum rust-ethereum sqlite tui
Last synced: 9 months ago
JSON representation
A minimalist TUI block explorer for Ethereum networks
- Host: GitHub
- URL: https://github.com/jmcph4/blocktop
- Owner: jmcph4
- License: mit
- Created: 2025-01-01T01:28:01.000Z (over 1 year ago)
- Default Branch: master
- Last Pushed: 2025-05-28T10:27:18.000Z (about 1 year ago)
- Last Synced: 2025-09-14T10:16:09.554Z (10 months ago)
- Topics: block-explorer, blockchain, blockchain-indexer, blockchain-indexing, ethereum, rust-ethereum, sqlite, tui
- Language: Rust
- Homepage:
- Size: 2.08 MB
- Stars: 17
- Watchers: 1
- Forks: 1
- Open Issues: 13
-
Metadata Files:
- Readme: README.md
- Contributing: CONTRIBUTING.md
- Funding: .github/FUNDING.yml
- License: LICENSE
- Codeowners: CODEOWNERS
- Security: SECURITY.md
Awesome Lists containing this project
README
# blocktop #
[](https://asciinema.org/a/698693)
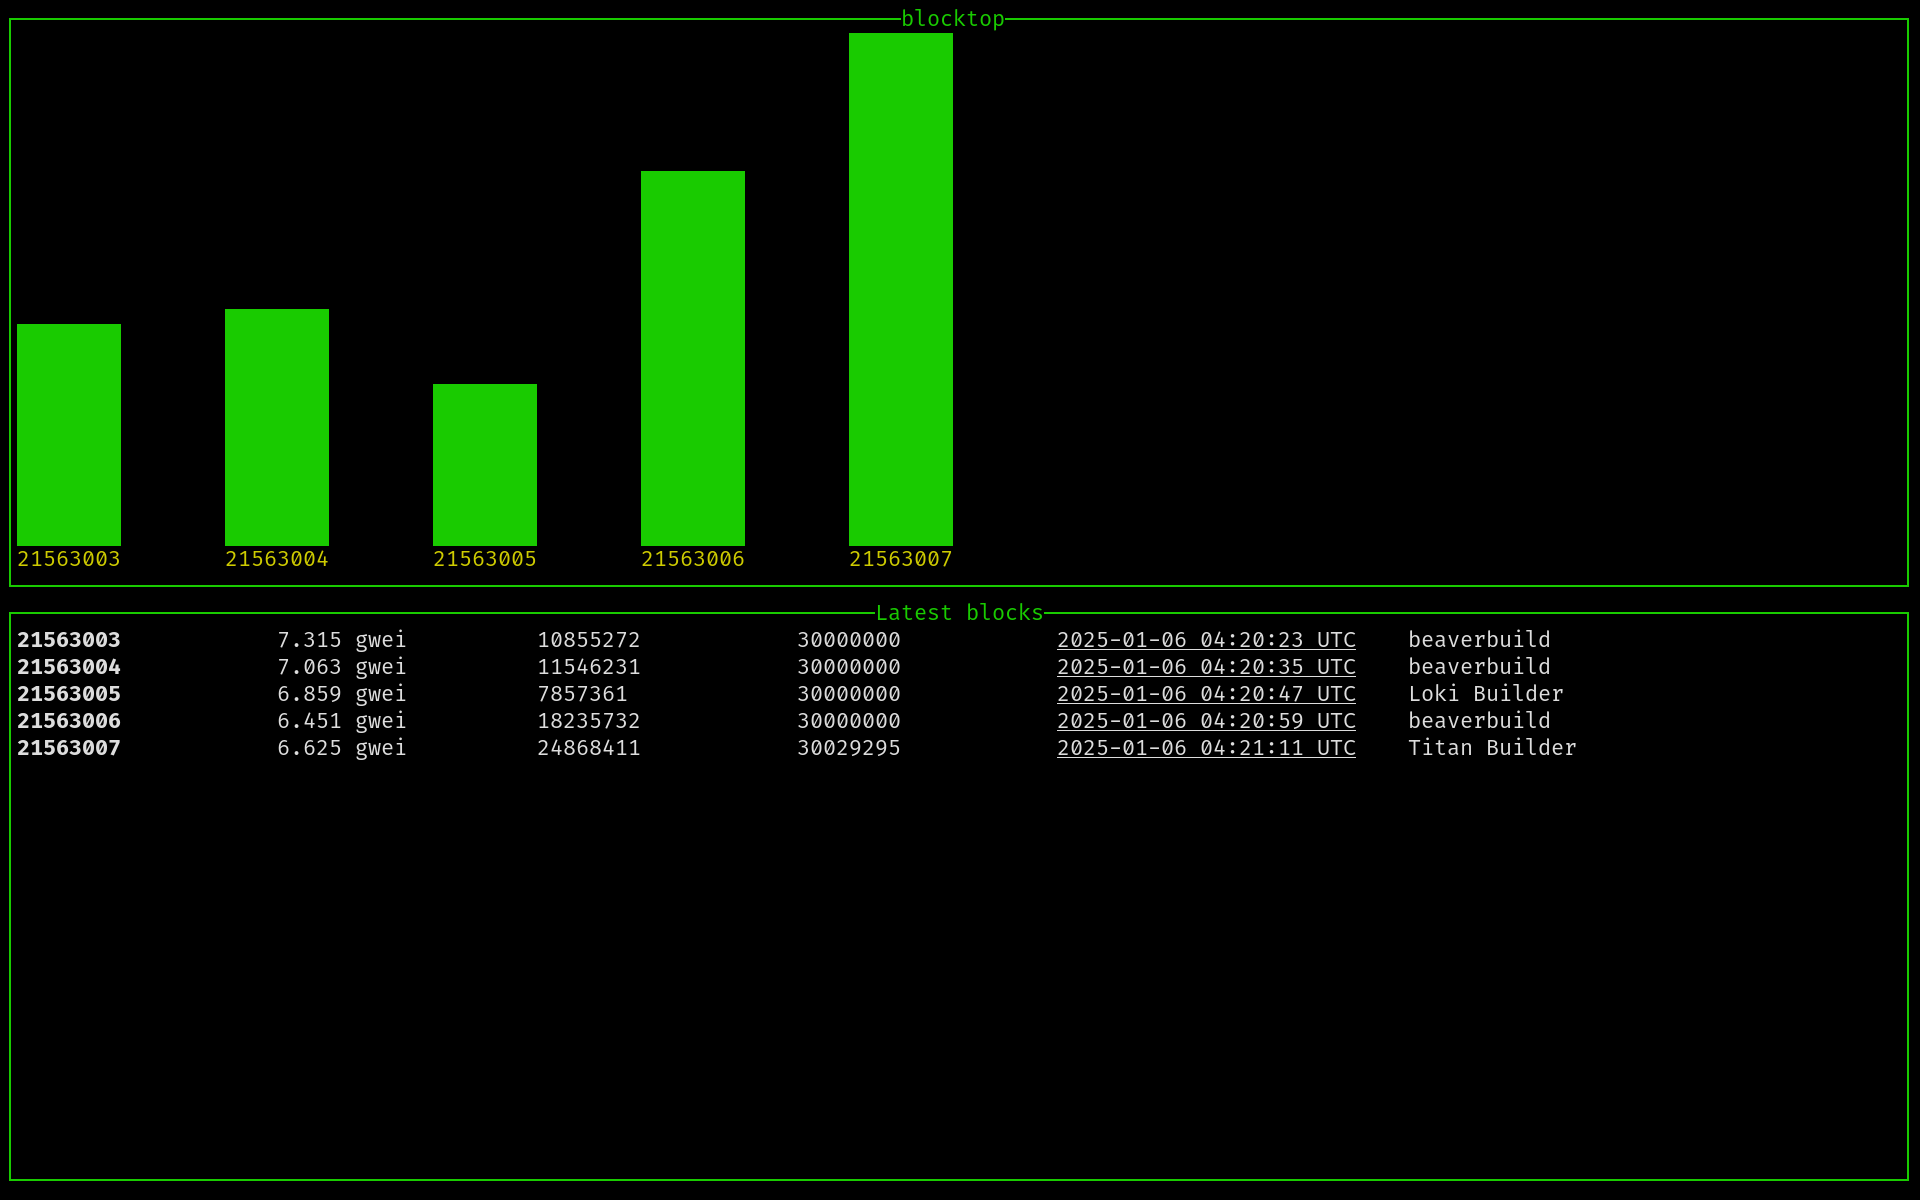
Minimalist TUI block explorer for Ethereum networks.
- Gain rapid insights into chain health by viewing new canonical blocks live in a visually clear, low-latency manner
- Drill down into specific details of individual blocks and transactions
- Store chain data to a relational schema using a simple, open format
See [FUNCTIONALITY](docs/FUNCTIONALITY.md) for the full feature list.
## Installation ##
```
$ cargo install blocktop
```
**Note**: `blocktop` is alpha software is is not stable yet.
## Usage ##
```
A minimalist TUI block explorer for Ethereum blockchains
Usage: blocktop [OPTIONS]
Options:
-r, --rpc [default: wss://eth.merkle.io]
-d, --db
--headless
--list-block-hashes
--block
--transaction
-s, --serve
-m, --metrics
-p, --port
-h, --help Print help
-V, --version Print version
```
At the moment, `blocktop` only supports Websockets or Unix domain sockets as transports for RPC communication. `blocktop` makes use of the [free Ethereum RPC service provided by Merkle](https://merkle.io/free-eth-rpc) by default.
### TUI Mode ###
The default invocation (i.e., `blocktop`) will open the TUI and start retrieving data from the default Ethereum RPC node using an in-memory SQLite database.
#### Controls ####
| Key | Action |
| --- | --- |
| `j`, `k`, `Up`, `Down` | Scrolls lists |
| `e` | In block or transaction view, opens the block or transaction in [Etherscan](https://etherscan.io), respectively |
| `q`, `Ctrl+c` | Exits the application |
| `Esc` | Returns to the previous page or exits the application if on the main page |
| `r` | Toggles the address display mode (i.e., labelled or raw) |
| `l` | In block view, opens the block in [libMEV](https://libmev.com) |
### Headless Mode ###
To invoke solely the indexer without the TUI frontend, specify the `--headless` flag. This mode is the most useful with the `RUST_LOG` environment variable configured to `info`:
```
$ RUST_LOG=info blocktop --headless
2025-05-28T10:14:05.298Z WARN blocktop > Headless mode without specifying an on-disk database. All data will be lost on exit.
2025-05-28T10:14:06.493Z INFO blocktop::client > Websockets client initialised (endpoint: wss://eth.merkle.io/, chain: 1)
2025-05-28T10:14:07.440Z INFO blocktop::db > Wrote block 0xed8f155905becde73d4eae0b03a3bd6ddce554aa0c4fe2495bc61238e6207885 to the database
2025-05-28T10:14:08.840Z INFO blocktop::client > Websockets client initialised (endpoint: wss://eth.merkle.io/, chain: 1)
2025-05-28T10:14:14.234Z INFO blocktop::db > Wrote block 0xe828b36306c36ed8d5175540e9444861507e27b8570760d1409787fb9ad233c7 to the database
```
As the warning-level log line at the start of the output indicates, headless operation also benefits from specifying an on-disk database to save chain state to:
```
$ RUST_LOG=info blocktop --headless --db foobar.db
```
#### Metrics ####
To expose metrics for scraping via Prometheus, use the `--metrics` flag:
```
$ RUST_LOG=info blocktop --headless --metrics
```
Then, concurrently:
```
$ curl http://localhost:9898/metrics
# HELP blocks_added The number of blocks added to the index
# TYPE blocks_added gauge
blocks_added 0
# HELP failed_rpc_requests The number of requests made to the RPC node that have received an error response
# TYPE failed_rpc_requests gauge
failed_rpc_requests 0
# HELP rpc_requests The number of requests made to the RPC node
# TYPE rpc_requests gauge
rpc_requests 0
```
Technically, metrics can be enable whilst using the TUI; however, one would imagine that it really only makes sense to collect metrics in order to view the state of the index.